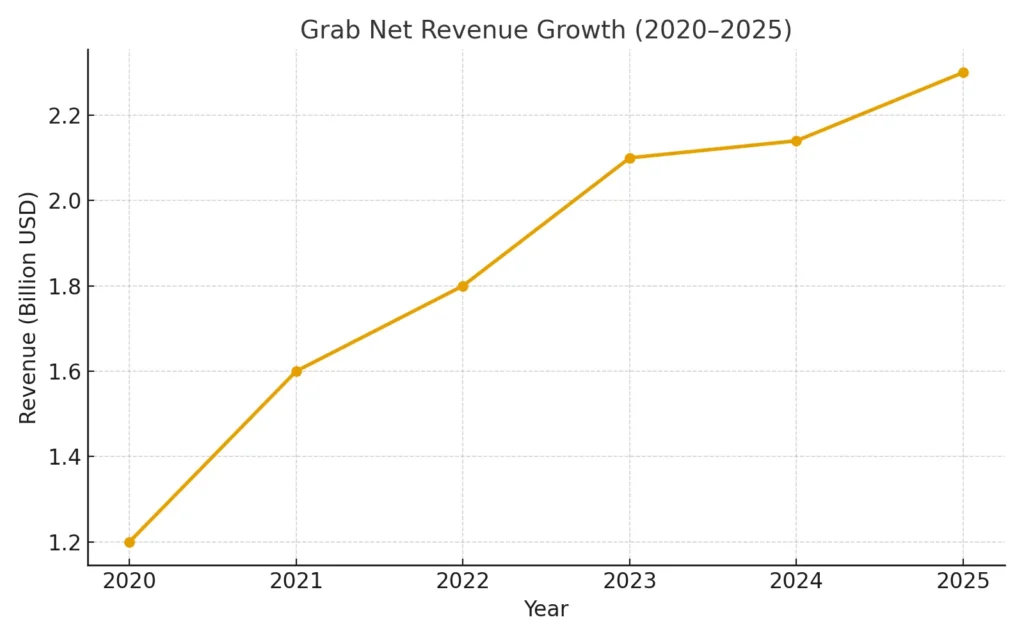
Grab reported $590 million in net revenue in Q2 2025, up nearly 18% year-over-year, pushing its annualized revenue past the $2.3 billion mark. Its fintech arm (Grab Financial Group) and food delivery business are now core profit drivers, while ride-hailing maintains dominance in Southeast Asia.
For entrepreneurs, understanding Grab’s multi-layered revenue model is like peeking under the hood of a super-app engine: commissions, fintech, advertising, subscriptions, and AI-powered pricing all working together.
By the end of this guide, you’ll know exactly how Grab makes money in 2025, how margins are improving, and what lessons entrepreneurs can apply when building their own platforms with Miracuves.
Grab Revenue Overview — The Big Picture
- Q2 2025 Net Revenue: $590M (+18% YoY)
- H1 2025 Net Revenue: $1.16B
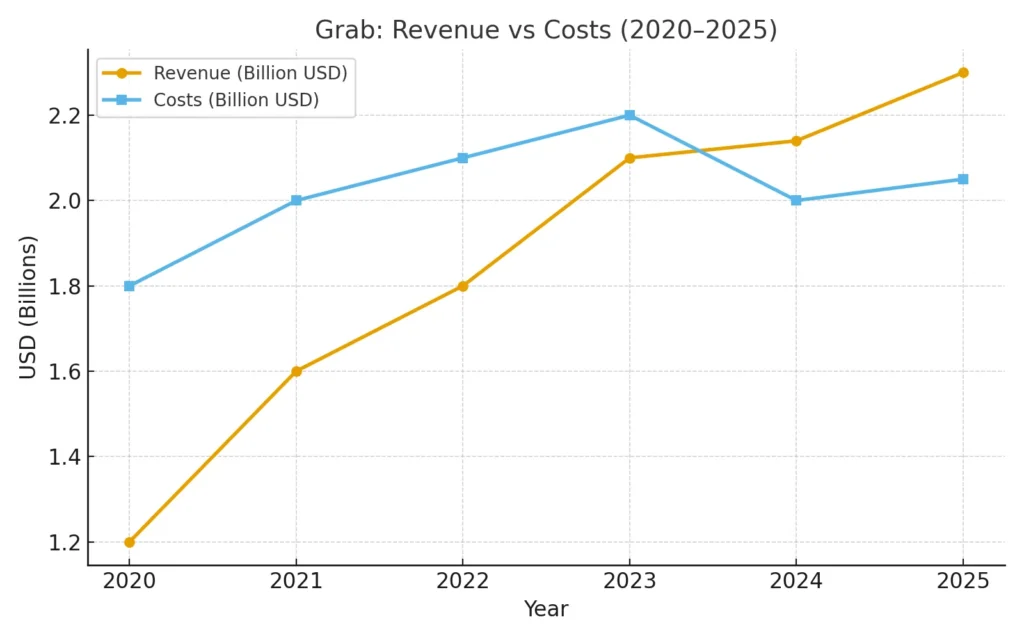
- 2024 Full-Year Revenue: $2.14B
- Market Cap (2025): $15–18B range
- Profitability: Adjusted EBITDA positive since late 2024
Year-over-Year Growth
- Mobility GMV +12% YoY
- Deliveries revenue +15% YoY
- Fintech revenue +50% YoY
Regional Breakdown
- Singapore & Malaysia: High ARPU markets
- Indonesia & Vietnam: Biggest growth drivers
- Philippines & Thailand: Expanding demand in rides and delivery
Profit Margins
- Delivery margins rising due to ads + subscriptions
- Fintech driving the highest margins
- Mobility remains profitable but capped by regulations
Read More: What Is Grab and How Does It Work? Complete 2025 Guide
Primary Revenue Streams — Deep Dive
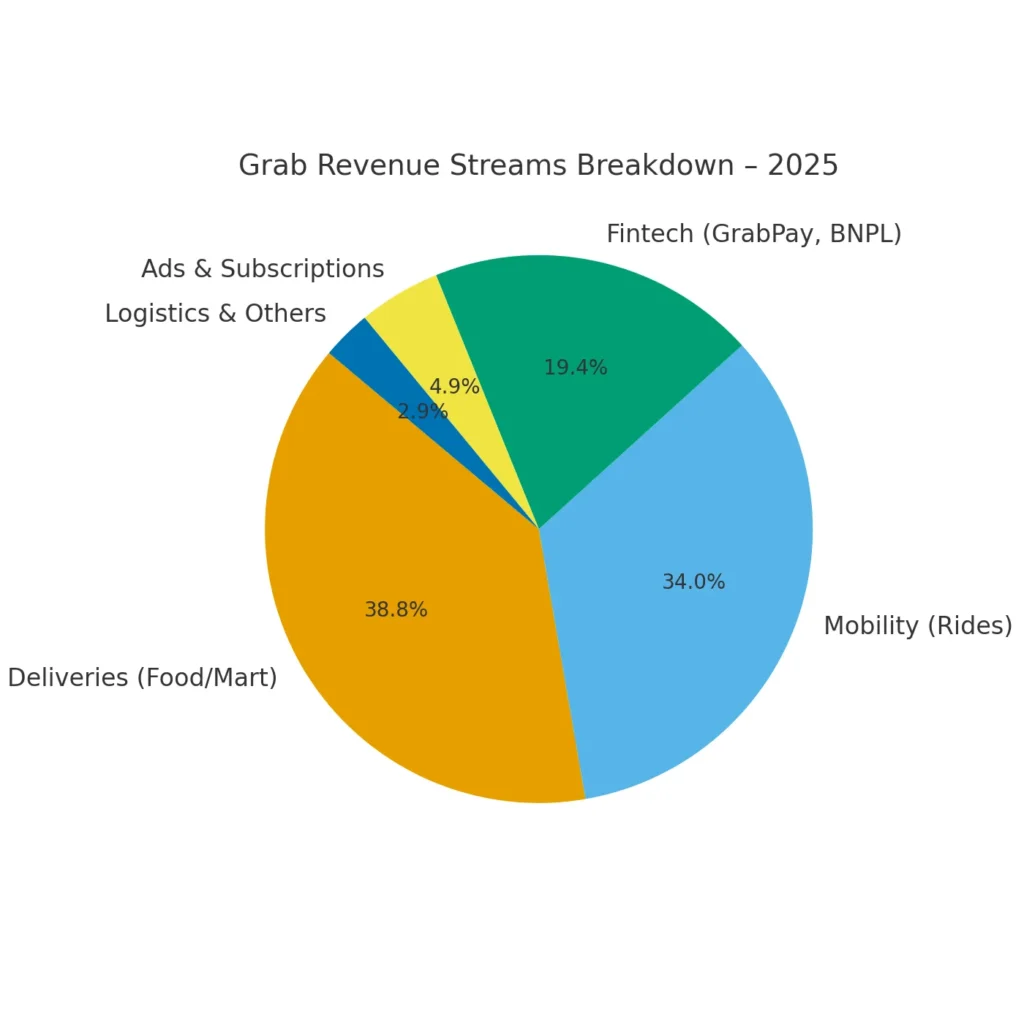
| Revenue Stream | % of Total Revenue | Growth Trend (YoY) |
|---|---|---|
| Deliveries (Food/Mart) | ~40% | +15% |
| Mobility (Ride-hailing) | ~35% | +12% |
| Financial Services (Fintech) | ~20% | +50% |
| Ads & Subscriptions | ~5% | +40% |
| Logistics & Others | <5% | +10% |
- Mobility: 10–20% commission per ride; $10 ride → ~$1.50 for Grab.
- Deliveries: 15–25% merchant commission + delivery fees; $20 food order → ~$6 for Grab.
- Fintech: MDR (1–2%), loan interest spreads, BNPL fees; loan book >$1.5B in 2025.
- Ads & Subscriptions: GrabUnlimited (~$2–3/month) + merchant ads (~3% GMV in 2025).
- Logistics: B2B last-mile delivery, small share but strategic.
The Fee Structure Explained
| User Type | Fee Types | Typical Range |
|---|---|---|
| Customers | Booking fees, surge fares, subscriptions, BNPL interest | $0.50–$2; surge 1.2×–2.0×; subscription $2–3/month |
| Drivers | Platform commission cut | 10–20% per ride |
| Merchants | Order commission, ads, promo co-funding | 15–25% commission; ads 1–3% GMV |
| Fintech Users | MDR, loan interest, insurance premiums | MDR 1–2%; BNPL APR varies |
- User fees: service fees, surge pricing, subscriptions.
- Provider fees: commissions, ads, MDRs.
- Hidden levers: merchant-funded promos, dynamic take rates.
- Regional pricing: higher in Singapore/Malaysia, more competitive in Indonesia/Vietnam.
How Grab Maximizes Revenue Per User
- Segmentation: High-frequency users → subscriptions + credit; occasional users → promos.
- Upselling: Premium rides, bundle orders, BNPL.
- Cross-selling: Food → rides; rides → payments; payments → lending.
- Dynamic pricing: AI-driven surge fares & delivery fees.
- Retention: GrabUnlimited loyalty, gamification, merchant-funded promos.
- LTV optimization: Multi-service users spend 2–3× more monthly.
- Psychological pricing: Free delivery thresholds, discount anchors, micro-installments.
Cost Structure & Profit Margins
Major Cost Categories:
- Technology infra (cloud, AI, app dev).
- Marketing (shift from subsidies → merchant-funded).
- Operations (driver incentives, logistics).
- R&D (fintech, adtech, insurance).
Unit Economics:
- Mobility: profitable but capped.
- Deliveries: margins rising with ads/subscriptions.
- Fintech: highest-margin segment.
Path to Profitability:
- Adjusted EBITDA positive since late 2024.
- Net revenue scaling faster than costs.
- 2025 focus: fintech & ads driving sustainable profit.
Read More: Best Grab Clone Scripts in 2025 – Features & Pricing Compared
Future Revenue Opportunities & Innovations
- Advertising expansion across rides & fintech.
- SME fintech tools (loans, POS, insurance).
- Subscriptions bundles combining rides, food, and perks.
- Driver ecosystem services (fuel, loans, maintenance).
- Cross-border payments via GrabPay.
Predictions 2025–2027:
- Fintech = >30% of revenue.
- Ads = 5–6% of GMV.
- Subscription bundles = key recurring revenue.
Threats: Regulation, competition (Shopee, Gojek), BNPL default risk, ad fatigue.
Opportunities for new players: Hyperlocal services, niche fintech, Tier-2 city penetration.
Lessons for Entrepreneurs & Your Opportunity
What works: super-app stickiness, fintech margins, ads/subscriptions.
What to replicate: flywheel growth, AI-driven personalization, merchant-funded promos.
What to improve: unit economics early, balance UX with ads, modular subscriptions.
Miracuves helps entrepreneurs build Grab-inspired platforms with built-in monetization models: commissions, ads, subscriptions, fintech integration.
Some clients see revenue in 30 days.
Get a free consultation to map out your revenue strategy.
Final Thought
Grab’s 2025 transformation proves that super-apps can be profitable when built with diversified monetization. The secret? Layering commissions, ads, subscriptions, and fintech on top of high-frequency services.
Entrepreneurs can take this blueprint and, with the right partner like Miracuves, adapt it into their own profitable ecosystem.
FAQs
1) How much does Grab make per transaction?
10–20% from rides, 15–25% from food, plus fees & fintech spreads.
2) What’s Grab’s most profitable stream?
Fintech (GrabPay, BNPL, insurance) — highest margins, fastest growth.
3) How does Grab’s pricing compare?
Comparable to Gojek and ShopeeFood, competitive in fintech rates.
4) What % does Grab take from providers?
Drivers: 10–20%, Merchants: 15–25%, MDR: 1–2%.
5) How has Grab’s model evolved?
From rides → food → fintech & ads (profitable since 2024).
6) Can small platforms use similar models?
Yes — commissions, ads, subscriptions, and payments scale down to niches.
7) Minimum scale for profitability?
Super-apps: tens of millions MAUs; niche apps: profitable earlier with lean ops.
8) How to implement similar models?
Start with commissions → add subscriptions → layer fintech & ads.
9) Alternatives to Grab’s model?
Vertical apps, e-commerce-first fintech, B2B logistics/payment hybrids.
10) How quickly can platforms monetize?
With the right model and Miracuves’ expertise, you can achieve launch-ready status in just 3–9 days with guaranteed delivery.


