Key Takeaways
What You’ll Learn
- Klarna’s revenue model is built around Buy Now, Pay Later services allowing users to split purchases into installments while merchants pay for increased conversion and sales growth.
- The platform earns primarily through merchant transaction fees because retailers benefit from higher order values, lower cart abandonment, and flexible checkout experiences.
- Consumer financing expands monetization opportunities through installment plans, longer-term financing, interest-based products, and repayment services.
- Klarna also operates as a shopping ecosystem combining payments, product discovery, rewards, affiliate commerce, and retailer partnerships inside one platform.
- The biggest takeaway for founders is that BNPL platforms grow successfully when checkout simplicity, merchant value, repayment management, and ecosystem engagement work together.
Stats That Matter
- The article positions Klarna as a global fintech and BNPL platform focused on installment payments, digital shopping experiences, and merchant checkout infrastructure.
- Core revenue comes from merchant-side transaction fees where retailers pay Klarna for flexible payment solutions that improve customer conversion rates.
- Additional monetization comes from consumer financing products including installment interest, late fees in some regions, and premium financial services.
- Klarna’s shopping ecosystem supports additional growth through affiliate partnerships, product recommendations, rewards systems, and integrated retailer discovery.
- The platform benefits from rising global BNPL adoption as consumers increasingly prefer flexible checkout and installment-based payment experiences.
Real Insights
- Klarna succeeds because it improves purchase affordability perception by turning larger one-time payments into smaller installment-based transactions.
- The strongest business advantage is merchant alignment since retailers directly benefit from higher conversions, increased order sizes, and smoother checkout experiences.
- Risk management is critical to profitability because repayment defaults, fraud prevention, user eligibility, and credit scoring directly affect BNPL sustainability.
- Shopping ecosystem features improve long-term engagement by turning the platform into more than a payment tool through rewards, discovery, and retailer integrations.
- For entrepreneurs, the biggest lesson is to build a Klarna-style fintech platform around BNPL checkout, merchant partnerships, repayment automation, shopping engagement, and scalable risk infrastructure.
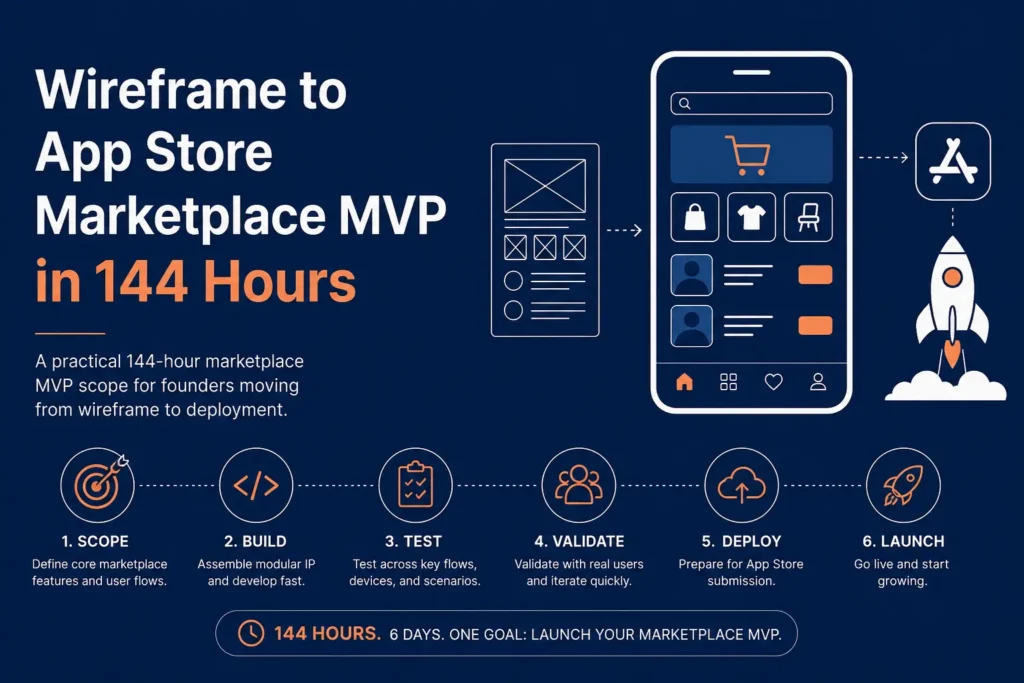
In 2026, Buy Now Pay Later (BNPL) platforms are no longer just payment tools—they are full-scale fintech ecosystems.
They now combine payments, consumer credit, merchant analytics, shopping discovery, loyalty programs, and financial services into a single experience, allowing platforms to own more of the transaction lifecycle and user relationship.
At the center of this shift is Klarna, which has transformed short-term credit into a multi-billion-dollar global business.
Beyond installments, Klarna monetizes merchant fees, consumer financing, subscriptions, advertising, and banking products, positioning itself as both a payments provider and a commerce platform embedded in everyday shopping.
For founders, Klarna’s revenue model is a masterclass in monetizing both sides of a marketplace while managing risk at scale.
It demonstrates how data-driven credit scoring, diversified revenue streams, and repeat-user economics can reduce default risk, improve margins, and create sustainable fintech growth even in regulated environments.
Klarna Revenue Overview – The Big Picture
- 2026 Revenue: ~$2.7 billion
- Valuation (2026 private market): ~$14–16 billion
- YoY growth (2024–2026): ~22%
- Revenue by region:
- Europe: 44%
- North America: 38%
- Asia-Pacific & others: 18%
- Average profit margins: 18–24% (improving with scale)
- Competition benchmark: Affirm, Afterpay, PayPal Pay Later
Read More: Klarna Explained – How This Buy Now, Pay Later App Works

Primary Revenue Streams Deep Dive
Revenue Stream #1: Merchant Transaction Fees
- How it works: Merchants pay Klarna a fee for offering BNPL at checkout
- Pricing: 3%–6% per transaction + fixed fee
- 2026 share: ~52% of total revenue
- Why it matters: Merchants see higher conversion rates and larger cart sizes
Revenue Stream #2: Consumer Interest & Late Fees
- How it works: Interest on longer-term financing plans and penalties on missed payments
- Pricing: 0%–29.99% APR depending on plan and region
- 2026 share: ~21%
Revenue Stream #3: Subscription Products (Klarna Plus)
- How it works: Monthly subscriptions offering discounts, cashback, and premium features
- Pricing: ~$7–10/month
- 2026 share: ~11%
Revenue Stream #4: Advertising & Sponsored Listings
- How it works: Brands pay to promote products inside Klarna’s app
- Pricing: CPC / CPA-based
- 2026 share: ~9%
Revenue Stream #5: Banking & Financial Services
- How it works: Savings accounts, cards, and wallet services
- 2026 share: ~7%
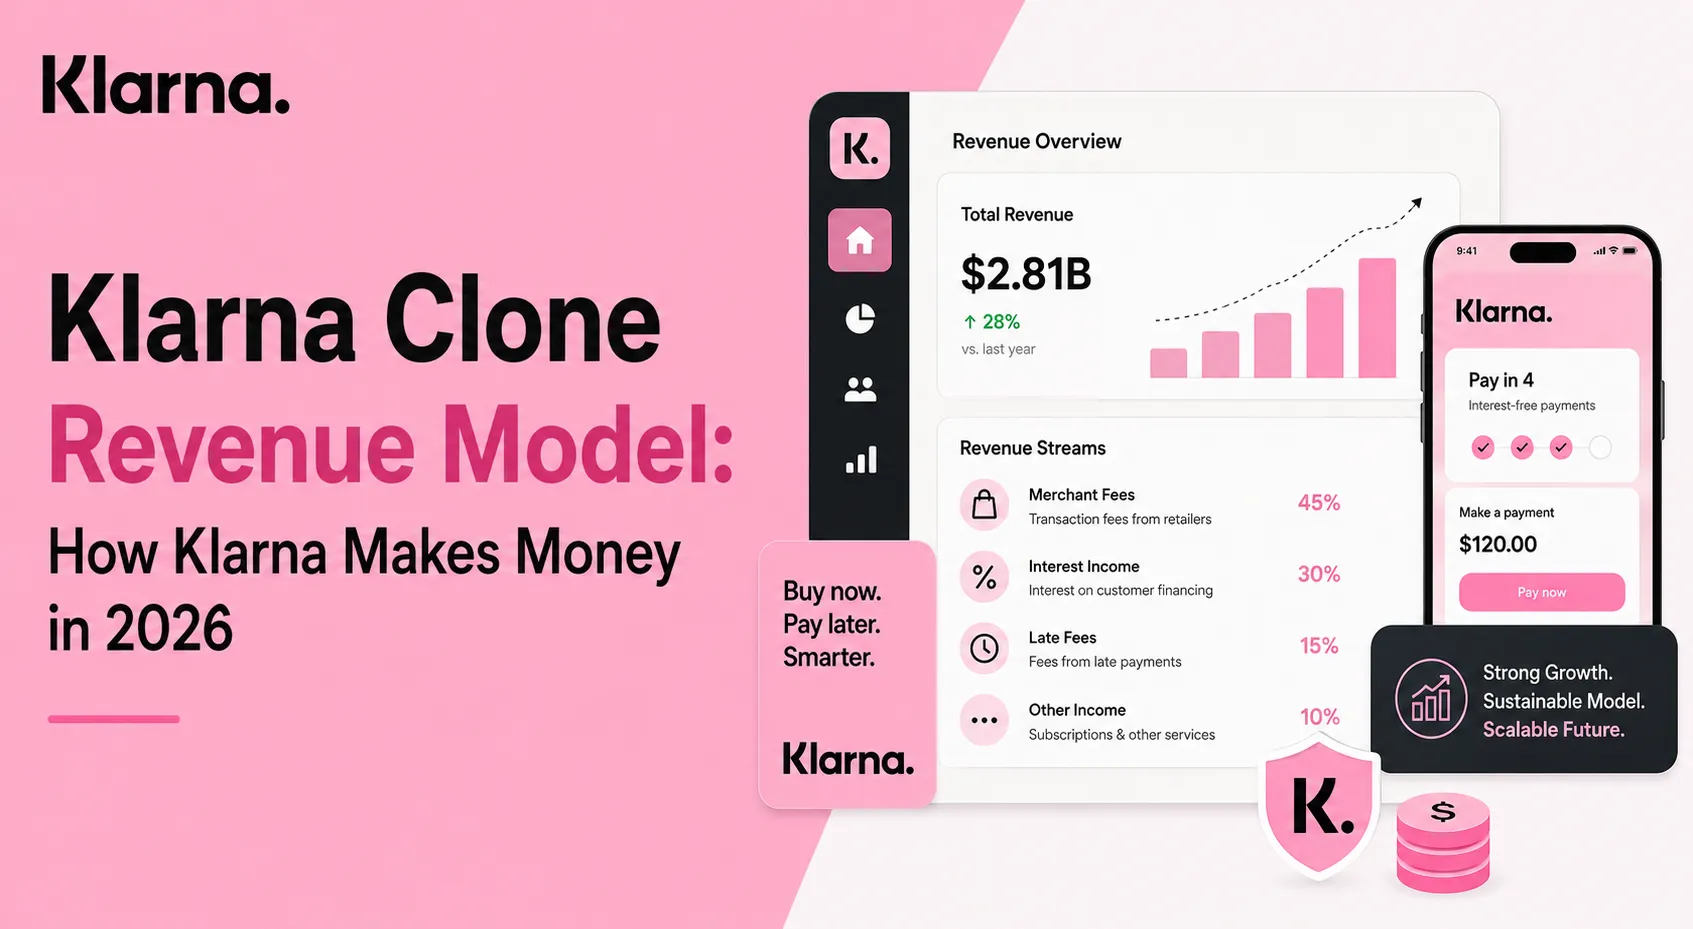
Revenue Streams Percentage Breakdown (2026)
| Revenue Stream | Revenue Share |
|---|---|
| Merchant Fees | 52% |
| Consumer Interest & Late Fees | 21% |
| Subscriptions | 11% |
| Advertising | 9% |
| Financial Services | 7% |
The Fee Structure Explained
User-Side Fees
- Interest on long-term installment plans
- Late payment penalties
- Optional subscription fees
Provider-Side (Merchant) Fees
- Transaction-based commission
- Integration & premium placement fees
Hidden Revenue Layers
- Float income on held funds
- Cross-selling financial products
Regional Pricing Variation
- Higher merchant fees in North America
- Lower consumer interest in EU due to regulations
Complete Fee Structure by User Type
| User Type | Fees Paid | Typical Cost Range |
|---|---|---|
| Shoppers (0% Plans) | None | $0 |
| Shoppers (Financing) | Interest & late fees | 5%–30% APR |
| Subscribers | Monthly subscription | $7–10/month |
| Small Merchants | Transaction fee | 3%–5% |
| Enterprise Merchants | Custom pricing | 2.5%–4% |
| Advertisers | Sponsored placements | Variable |
How Klarna Maximizes Revenue Per User
- Segmentation: Casual shoppers vs power users
- Upselling: Longer installment plans
- Cross-selling: Subscriptions, cards, savings
- Dynamic pricing: Risk-based interest rates
- Retention monetization: App-based shopping discovery
- LTV optimization: Returning users spend ~2.3× more annually
- Psychological pricing: “Pay later” framing reduces friction
- Real data example: Merchants report up to 40% conversion uplift
Cost Structure & Profit Margins
Infrastructure Cost
- Payments processing & cloud systems (~14%)
CAC & Marketing
- Merchant acquisition & consumer incentives (~22%)
Operations
- Customer support, compliance, fraud (~16%)
R&D
- Credit models, risk engines, product innovation (~12%)
Unit Economics
- Average revenue per transaction: ~$5.20
- Average cost per transaction: ~$3.80
Profitability Path
- Profitability improves significantly after repeat-user density
Read More: Best Klarna Clone Scripts 2025 – Launch a BNPL App Faster
Future Revenue Opportunities & Innovations
- New streams: B2B financing for merchants
- AI/ML monetization: Smarter credit scoring & pricing
- Market expansion: Emerging markets BNPL
- Predicted trends (2026–2027):
- BNPL + loyalty ecosystems
- Embedded finance partnerships
- Risks: Regulatory tightening, credit defaults
- Opportunities for founders: Niche BNPL verticals
Lessons for Entrepreneurs & Your Opportunity
What Works
- Monetizing both consumers and merchants
- Strong data-driven risk management
What to Replicate
- Checkout-native integration
- App-based shopping discovery
Market Gaps
- BNPL for B2B, healthcare, education
- Transparent-fee alternatives
Improvements Founders Can Use
- Faster merchant onboarding
- Smarter repayment nudges
Miracuves Klarna-Like BNPL Platform Solution Cost and Tech Stack
Miracuves Pricing for a Klarna-Like Buy Now Pay Later Platform developed using JavaScript architecture is available on request. Final pricing depends on payment gateway integration, BNPL workflows, credit logic, user onboarding systems, scalability requirements, compliance layers, and deployment scope. Estimated delivery timeline: 30 to 90 days.
Get a fully developed, custom fintech platform modeled around Klarna-style Buy Now Pay Later capabilities. Built on a modern JavaScript foundation, this solution can be customized for fintech startups, digital payment companies, eCommerce businesses, lending platforms, marketplaces, retailers, and financial service providers.
- Core Workflows: BNPL checkout, installment payments, customer onboarding, merchant payments, virtual cards, transaction tracking, repayment scheduling, wallet management, order processing, and user financial dashboards.
- Built-in Revenue Logic: Merchant commission fees, installment interest models, late payment charges, premium financing plans, subscription services, payment processing fees, API monetization, and enterprise partnership models.
- Management Hub: Admin dashboard, user management, repayment tracking, merchant management, payment monitoring, fraud detection tools, analytics systems, subscription controls, and compliance management.
- Fintech-Ready Architecture: Prepared for payment gateway integration, banking APIs, fraud prevention systems, KYC verification, scalable financial workflows, secure transaction handling, and enterprise-grade fintech infrastructure.
Why Does a Klarna-Like Platform Require JavaScript Architecture?
A Klarna-like BNPL platform requires more than a basic payment gateway setup. It handles real-time transactions, installment calculations, merchant integrations, repayment systems, financial tracking, user authentication, fraud prevention, and high-volume payment operations. A modern JavaScript architecture helps manage these interactive fintech workflows smoothly across customers, merchants, admins, and financial systems.
We recommend JavaScript architecture for this type of platform because:
- Built for Real-Time Financial Workflows: JavaScript supports fast payment processing, installment calculations, live transaction updates, repayment tracking, and seamless checkout experiences.
- Advanced Frontend Experience: React.js or similar JavaScript frameworks can power smooth payment dashboards, BNPL checkout systems, wallet interfaces, merchant portals, financial analytics, and admin controls.
- Scalable Backend Logic: JavaScript-based backend systems can efficiently manage payment APIs, user sessions, transaction processing, installment schedules, merchant payouts, fraud detection, and high-volume fintech operations.
- Flexible Integration Layer: The platform can connect with banking APIs, payment gateways, KYC providers, fraud prevention systems, analytics platforms, CRM tools, enterprise authentication systems, and third-party financial services.
You get a scalable BNPL fintech platform designed for seamless payments, recurring revenue generation, merchant growth, and long-term financial product scalability.
Note: Final pricing depends on payment gateway selection, BNPL logic complexity, compliance requirements, KYC systems, fraud protection layers, infrastructure scale, transaction volume, and custom feature development.
Final Thought
Klarna proves that payments can evolve into platforms.
What began as a checkout financing option has expanded into a commerce-driven fintech ecosystem, where payments act as the entry point for recurring user engagement, data collection, and cross-selling of financial products.
Its success lies in blending credit, commerce, and data into a seamless user experience.
By using real-time spending data, behavioral insights, and risk analytics, Klarna personalizes offers, optimizes credit decisions, and increases transaction frequency while maintaining control over defaults and margins.
For founders, BNPL remains one of the clearest monetization opportunities in fintech.
The model offers **multiple revenue levers—merchant fees, consumer financing, subscriptions, and embedded services—**making it highly scalable for platforms that focus on niche markets, responsible lending, and strong unit economics.
FAQs
1. How much does Klarna make per transaction?
On average, about $4–6 depending on merchant and plan.
2. What’s Klarna’s most profitable revenue stream?
Merchant transaction fees.
3. How does Klarna’s pricing compare to competitors?
Comparable fees but stronger consumer engagement.
4. What percentage does Klarna take from merchants?
Roughly 3%–6% per transaction.
5. How has Klarna’s revenue model evolved?
From pure BNPL to a commerce-driven fintech app.
6. Can small platforms use similar models?
Yes, especially in niche or regional markets.
7. What’s the minimum scale for profitability?
Typically millions of transactions annually.
8. How to implement similar revenue models?
Combine merchant fees, financing, and subscriptions.
9. What are alternatives to Klarna’s model?
Pay-in-advance discounts, wallets, or credit cards.