Key Takeaways
What You’ll Learn
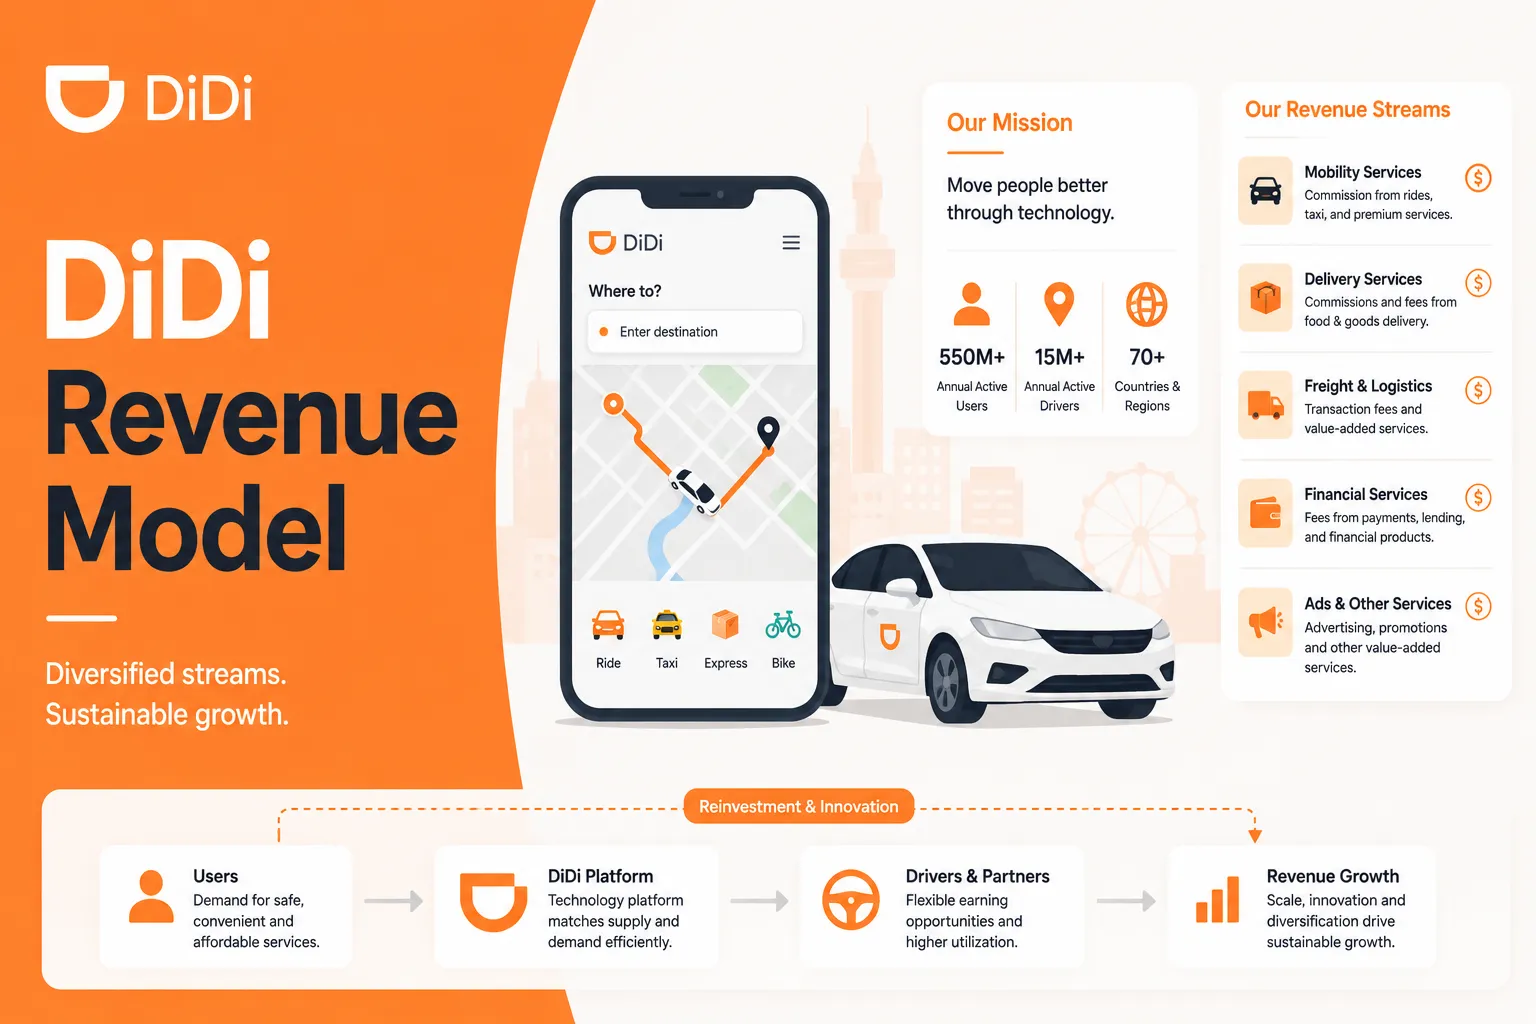
- DiDi operates as a ride-hailing marketplace connecting riders, drivers, and mobility services.
- The platform earns revenue mainly through ride commissions and dynamic pricing margins.
- Additional income comes from delivery logistics, subscriptions, and advertising services.
- The business model scales through network effects and high ride frequency.
- The platform focuses on expanding mobility services beyond standard ride-hailing.
Stats That Matter
- Ride commissions contribute the largest share of revenue for ride-hailing platforms.
- Platform commissions typically range between 15% and 30% per ride.
- Dynamic pricing during peak demand increases overall earnings.
- Delivery services, subscriptions, and advertising create additional revenue streams.
- Marketplace scalability improves as rider demand and driver availability grow together.
Real Insights
- Ride-hailing platforms scale efficiently because they operate without owning vehicles.
- Frequent daily usage increases customer retention and lifetime value.
- Multi-service ecosystems help expand revenue beyond transportation alone.
- Smart pricing algorithms play a major role in improving profitability.
- Long-term success depends on balancing growth, supply, customer experience, and operational efficiency.
Ride-hailing platforms have transformed urban transportation by connecting passengers with drivers through mobile apps. By 2026, large mobility platforms similar to DiDi operate with multi-billion-dollar annual revenues, driven by ride commissions, logistics services, and expanding mobility ecosystems.
For founders and startup operators, the DiDi-style platform offers a powerful case study in marketplace economics, platform scalability, and multi-service monetization. Understanding how these platforms generate revenue provides valuable insights for building scalable on-demand marketplaces.
DiDi Revenue Overview – The Big Picture
A DiDi-style platform functions as a mobility marketplace, connecting riders, drivers, delivery services, and logistics providers through a centralized mobile platform.
Financial Snapshot (Estimated 2025–2026)
Estimated Annual Revenue Run Rate: $25B–$35B
Estimated Company Valuation Range: $50B–$70B for leading ride-hailing platforms
Year-over-Year Growth: ~20–35% driven by urban mobility demand
Profitability Status: Many platforms still balancing growth and profitability due to driver incentives and expansion costs
Primary Users: Daily commuters, travelers, gig drivers, delivery partners
Geographic Revenue Distribution (Typical)
Asia-Pacific: ~50%
North America: ~20%
Latin America: ~15%
Europe: ~10%
Other regions: ~5%
Competitive Benchmark
DiDi-style platforms compete with:
- other ride-hailing companies
- taxi aggregation apps
- delivery platforms
- mobility-as-a-service providers
The key competitive advantage comes from network effects and driver-rider liquidity.
Read More: Best DiDi Clone Script 2025 | Ride-Hailing App Development

Primary Revenue Streams Deep Dive
Ride-hailing platforms typically monetize through commissions, logistics services, and platform partnerships.
Revenue Stream #1: Ride Commission Fees
The core revenue source comes from commissions taken from each ride booked through the platform.
When a passenger books a ride:
- the passenger pays the total fare
- the driver receives a percentage
- the platform takes a commission
Typical commission range: 15–30% per ride
Estimated revenue share: 55–65%
This revenue stream scales directly with ride volume.
Revenue Stream #2: Dynamic Pricing (Surge Pricing)
Ride-hailing apps use dynamic pricing algorithms to balance supply and demand.
During peak demand periods:
- ride prices increase
- platform commissions increase proportionally
Surge pricing significantly boosts revenue during:
- rush hours
- major events
- bad weather conditions
Estimated revenue share: 10–15%
Revenue Stream #3: Food and Delivery Logistics
Many mobility platforms expand into food delivery and logistics services.
These services generate revenue through:
- restaurant commissions
- delivery fees
- logistics partnerships
Estimated revenue share: 10–15%
Revenue Stream #4: Advertising and Promotions
Ride-hailing apps monetize their user base through advertising placements.
Examples include:
- in-app promotions
- restaurant advertisements
- brand campaigns
- sponsored driver promotions
Estimated revenue share: 3–5%
Revenue Stream #5: Mobility Subscriptions
Some platforms offer ride subscription plans that provide benefits such as:
- discounted rides
- priority booking
- reduced surge pricing
Subscription models generate recurring revenue.
Estimated revenue share: 5–7%
Revenue Streams Breakdown (Latest Estimated Data)
| Revenue Stream | Description | Estimated Revenue Share | Pricing Model |
|---|---|---|---|
| Ride Commissions | Percentage of each ride fare | 55–65% | Platform commission |
| Surge Pricing | Dynamic fare adjustments during peak demand | 10–15% | Variable pricing |
| Delivery Logistics | Food delivery and courier services | 10–15% | Delivery fees and commissions |
| Subscriptions | Premium ride membership plans | 5–7% | Monthly subscription |
| Advertising | Brand and merchant promotions in app | 3–5% | Ad placements |
The Fee Structure Explained
Ride-hailing platforms use layered pricing models to balance rider affordability and driver earnings.
Rider-Side Fees
Passengers pay:
- base fare
- distance charges
- time charges
- booking fees
Dynamic pricing may increase these costs during peak demand.
Driver-Side Fees
Drivers typically pay the platform through:
- ride commissions
- service fees
- optional premium driver programs
This ensures the platform earns revenue from each completed trip.
Platform Commissions
The platform’s primary monetization comes from commission percentages deducted from ride fares.
This marketplace structure allows the company to scale without owning vehicles.
Additional Revenue Layers
Additional monetization includes:
- cancellation fees
- priority ride services
- delivery partnerships
- financial services for drivers
Platform Fee Structure (Estimated Data)
| User Type | Fee Type | Typical Fee Range | Notes |
|---|---|---|---|
| Riders | Booking Fee | $1–$3 per ride | Platform service charge |
| Riders | Surge Pricing | 1.2x–3x base fare | Based on demand |
| Drivers | Platform Commission | 15–30% per ride | Main platform revenue |
| Merchants | Delivery Commission | 15–25% | Food delivery services |
| Subscribers | Membership Plan | $5–$15/month | Discounted rides |
How a DiDi Clone Maximizes Revenue Per User
Ride-hailing platforms rely heavily on user engagement and trip frequency.
Customer Segmentation
Typical platform users include:
- daily commuters
- airport travelers
- tourists
- gig drivers
- delivery partners
Frequent riders generate the highest lifetime value.
Upselling Ride Options
Platforms offer multiple ride categories:
- economy rides
- premium rides
- luxury rides
- carpool rides
Premium ride categories increase average revenue per trip.
Cross-Selling Mobility Services
Ride-hailing apps expand into additional services such as:
- food delivery
- package delivery
- bike and scooter rentals
These services increase platform usage.
Dynamic Pricing Algorithms
Smart algorithms adjust pricing based on:
- ride demand
- driver availability
- traffic conditions
This ensures optimal revenue during peak demand.
Retention Monetization
Platforms retain customers through:
- loyalty rewards
- ride discounts
- subscription plans
Frequent usage significantly increases customer lifetime value.
Cost Structure & Profit Margins
Ride-hailing platforms operate with significant operational costs despite being digital marketplaces.
Driver Incentives
Platforms often provide incentives to attract and retain drivers.
These include:
- sign-up bonuses
- ride guarantees
- peak-hour bonuses
Driver incentives represent a major operational cost.
Technology Infrastructure
Key infrastructure investments include:
- mobile app development
- GPS routing systems
- payment processing infrastructure
- real-time ride matching algorithms
Customer Acquisition Costs
User acquisition expenses include:
- promotional ride discounts
- referral programs
- marketing campaigns
Competition between ride-hailing apps often increases acquisition costs.
Safety and Compliance
Ride-hailing platforms must invest heavily in:
- driver background checks
- passenger safety tools
- regulatory compliance
These systems are critical for platform trust.
Unit Economics
Ride-hailing profitability depends on trip volume and operational efficiency.
Higher ride volumes improve margins by spreading platform costs across millions of transactions.

Future Revenue Opportunities (2026–2028 Outlook)
Mobility platforms continue to evolve beyond ride-hailing.
Autonomous Mobility
Self-driving vehicles could dramatically change ride-hailing economics by eliminating driver costs.
Electric Vehicle Fleets
Platforms may invest in EV fleets to reduce operating costs and meet sustainability goals.
Urban Logistics
Same-day delivery and last-mile logistics represent major growth opportunities.
Mobility Super Apps
Future ride-hailing apps may combine:
- transportation
- delivery
- payments
- travel services
This could turn mobility apps into super apps.
Risks and Threats
Key risks include:
- regulatory restrictions
- driver protests
- intense competition
- rising fuel costs
Platforms must constantly innovate to maintain market leadership.
Lessons for Entrepreneurs
The DiDi-style platform model offers several lessons for founders.
Network Effects Are Critical
Ride-hailing platforms grow stronger as more drivers and riders join the network.
Marketplace Liquidity Drives Success
The faster riders get matched with drivers, the more valuable the platform becomes.
Multi-Service Platforms Increase Revenue
Expanding into delivery, logistics, and mobility services helps diversify income.
Data and Algorithms Are Strategic Assets
Smart routing, demand prediction, and pricing algorithms significantly impact profitability.
Miracuves DiDi-Like Ride-Hailing Platform Solution Cost and Tech Stack
Miracuves Pricing for a DiDi-Like Ride-Hailing & Mobility Platform developed using Node.js / React.js Architecture is available on request. Contact Miracuves for custom pricing based on platform features, scalability requirements, integrations, and deployment scope. Estimated delivery timeline: 30 to 90 Days.
Build a powerful ride-hailing and urban mobility platform designed for startups, transportation companies, taxi operators, logistics businesses, and enterprise mobility operations.
Core Workflows: Ride booking management, driver-passenger matching, live ride tracking, fare calculation, trip scheduling, payment processing, route optimization, and mobility service workflows.
Built-in Mobility Operations: Real-time GPS tracking, surge pricing systems, driver onboarding workflows, trip analytics, wallet management, transaction monitoring, dispatch systems, and customer communication tools.
Management Hub: Admin dashboards, driver management systems, fleet monitoring, ride analytics, dispute management, reporting dashboards, audit logs, and centralized transportation operations management.
Enterprise-Ready: Fully customizable architecture prepared for secure scaling, multi-city operations, high-volume ride requests, enterprise fleet management, cloud infrastructure expansion, and long-term platform growth.
Why does a DiDi-Like Platform require Node.js / React.js architecture?
Ride-hailing platforms process real-time ride requests, live GPS tracking, payment operations, and concurrent driver-passenger interactions. These platforms require scalable infrastructure, low-latency processing, and highly responsive interfaces across web and mobile ecosystems.
We recommend a modern JavaScript-based architecture for this type of platform because:
Built for Real-Time Operations: Node.js enables scalable backend operations for ride dispatch systems, GPS synchronization, fare calculations, live trip tracking, and concurrent transportation workflows.
Advanced Dashboard Experience: React.js supports highly interactive interfaces for ride booking, driver dashboards, live maps, trip analytics, fleet management, and seamless customer experiences.
Enterprise Scalability: This architecture is well-suited for handling high ride volumes, multi-city mobility ecosystems, fleet operations, and rapidly growing transportation platforms.
Flexible Integration Layer: Easily integrates with mapping APIs, payment gateways, GPS tracking systems, communication platforms, analytics tools, fleet management systems, and third-party mobility services.
You get a scalable, enterprise-grade ride-hailing platform designed for long-term operational growth.
Note: Final pricing depends on platform modules, mapping integrations, deployment infrastructure, payment systems, fleet management complexity, and custom workflow development.
Final Thought
The DiDi-style ride-hailing platform demonstrates how digital marketplaces can reshape entire industries. By combining mobility, logistics, and technology infrastructure, these platforms create powerful network effects and scalable revenue models.
For founders building marketplace startups, this model offers a blueprint for creating high-growth platform businesses.
FAQs
1. How much does a ride-hailing platform earn per trip?
Platforms typically take a commission ranging from roughly 15% to 30% of the total fare.
2. What is the most profitable revenue stream for ride-hailing apps?
Ride commissions remain the largest revenue driver.
3. How does pricing compare to traditional taxis?
Ride-hailing platforms often use dynamic pricing to adjust fares based on demand.
4. What percentage does the platform take from drivers?
Most platforms charge drivers commissions between 15% and 30%.
5. How has the revenue model evolved?
Modern platforms now combine ride-hailing, delivery services, and advertising revenue.
6. Can startups build a similar platform?
Yes, but it requires strong network effects and a large supply of drivers.
7. What scale is required for profitability?
Ride-hailing platforms typically need millions of rides per day to achieve strong margins.
8. How can founders implement a similar model?
Startups usually begin with a focused geographic market before expanding into other mobility services.
9. What alternatives exist to ride-hailing revenue models today?
Alternatives include micro-mobility services, car-sharing platforms, and subscription-based mobility services.