Uber reported a staggering $10.7 billion in revenue in Q2 2025, up 15% year-over-year, while achieving a $1.2 billion net profit — marking one of its most profitable quarters ever. From ride-hailing to Uber Eats to advertising, the company has evolved far beyond a ridesharing app into a global mobility and logistics powerhouse.
For entrepreneurs, Uber’s success story is more than just numbers. It’s proof of how diverse monetization streams, smart pricing, and ecosystem strategy can transform a platform into a profit engine.
By the end of this guide, you’ll understand:
- Uber’s 2025 revenue structure
- Its main income sources and fee strategies
- How it maximizes revenue per user
- What lessons entrepreneurs can apply to their own ventures with Miracuves

Uber Revenue Overview — The Big Picture
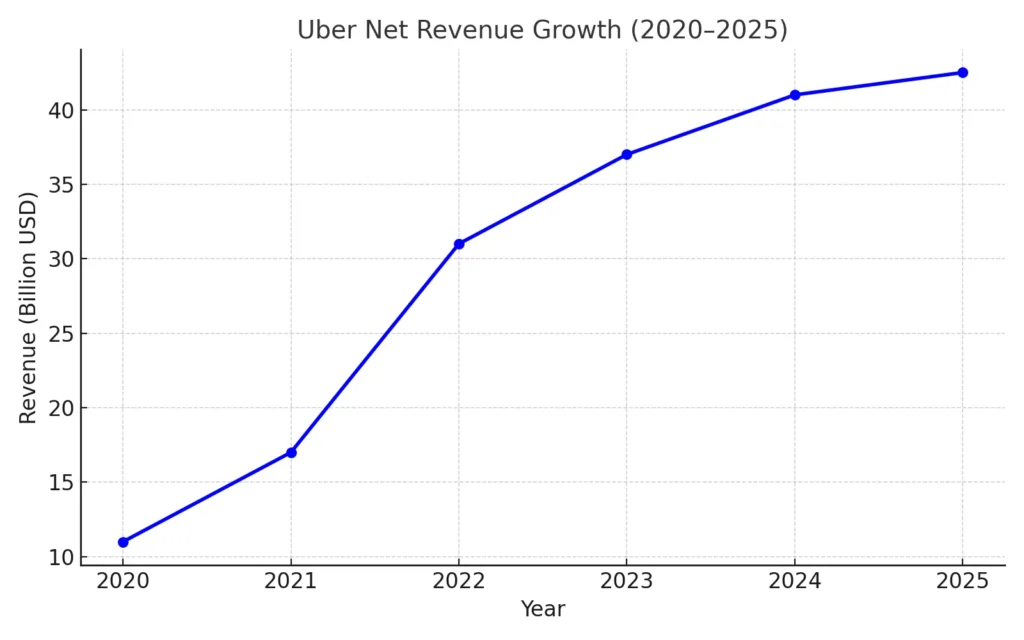
- Q2 2025 Revenue: $10.7 billion (+15% YoY)
- H1 2025 Revenue: $21.1 billion
- Net Profit (Q2 2025): $1.2 billion
- Market Cap (2025): ~$145–150 billion
- Gross Margin: ~50%
- Operating Margin: ~12%+
Revenue Breakdown by Region
- North America: Largest market, contributing ~55% of revenue.
- Europe, Middle East & Africa (EMEA): ~25%.
- Asia-Pacific & LATAM: ~20%, with strong growth in India, Brazil, and Australia.
Profit Margins Analysis
- Gross margin: ~50% across mobility and delivery.
- Operating margin: Improving to 12%+ in 2025, driven by efficiency and ad revenue.
- Net margin: Stabilizing around 10–12%, rare for gig-economy platforms.
Market Position vs Competitors
- Uber vs. Lyft: Uber dominates with ~70% US ride-hailing market share.
- Uber Eats vs. DoorDash: DoorDash leads in the US, but Uber Eats is stronger internationally.
- Global Mobility: Uber remains the #1 player worldwide, unmatched in multi-service reach.
Read More: Build an App Like Uber Delivery – Developer’s Guide

Primary Revenue Streams — Deep Dive
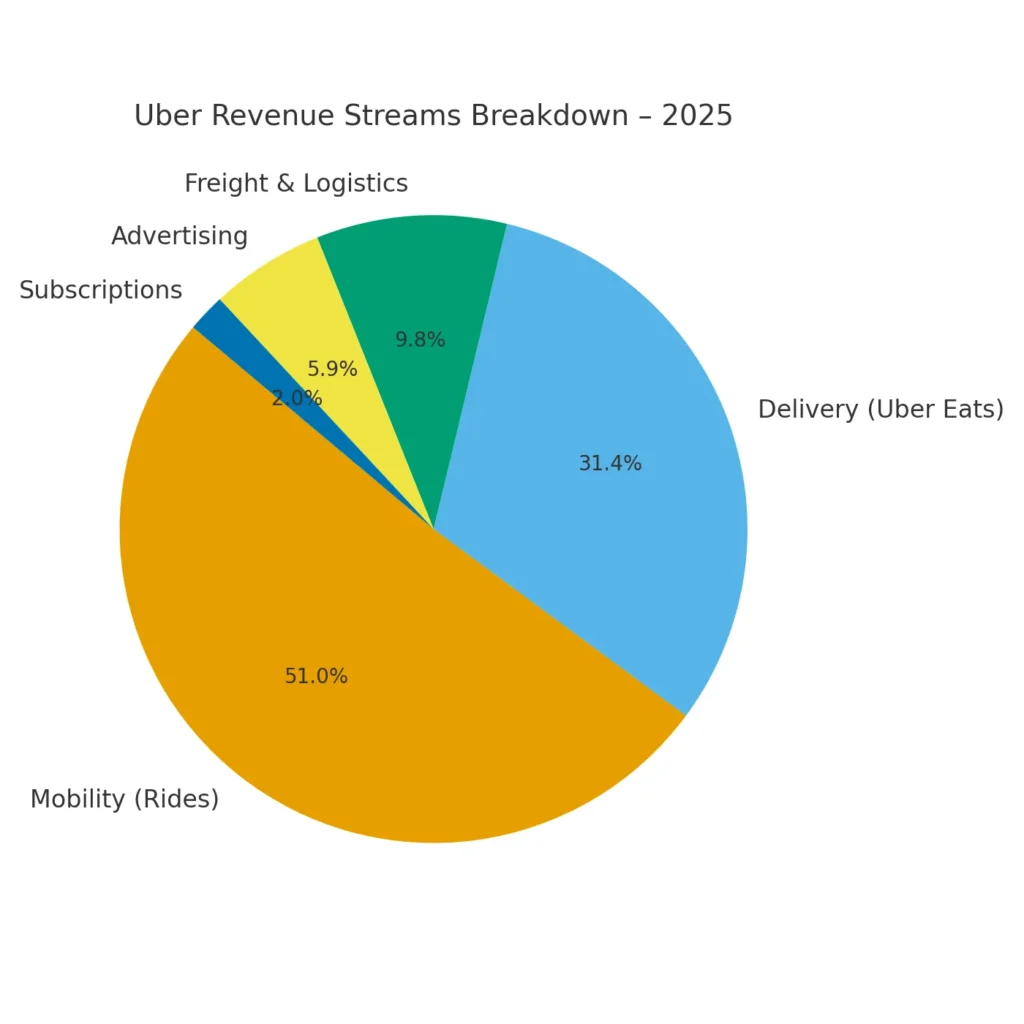
| Revenue Stream | % of Total Revenue | Growth Trend (YoY) |
|---|---|---|
| Mobility (Rides) | ~52% | +18% |
| Delivery (Uber Eats) | ~32% | +12% |
| Freight & Logistics | ~10% | +8% |
| Advertising (Uber Ads) | ~6% | +50% |
| Subscriptions (Uber One) | ~2% | +25% |
- Mobility: $20 ride → Uber keeps ~$4–5.
- Eats: $25 order → Uber earns ~$5–7.
- Freight: Keeps ~8–10% per load.
- Ads: Sponsored listings, now $1B+ annual revenue.
- Subscriptions: Uber One at $9.99/month drives retention.
The Fee Structure Explained
| User Type | Fee Types | Typical Range |
|---|---|---|
| Riders | Booking fee, surge pricing, premium rides | $1–$3 fee; surge 1.2×–2.5× |
| Eats Users | Delivery & service fees, subscriptions | $2–$6/order; $9.99/month |
| Drivers | Platform commission cut | 20–25% per ride |
| Merchants | Commission, ads, promos | 15–30% order cut; ads 1–3% GMV |
| Shippers | Freight load fees | 5–10% per contract |
- User fees: Booking, surge, premium upgrades.
- Provider fees: Commissions, ads, transaction charges.
- Hidden tactics: Surge pricing, merchant-funded promos, cross-service bundling.
- Regional variations: Higher in US/Europe; lower in Asia/LatAm.
How Uber Maximizes Revenue Per User
- Segmentation: Frequent users → Uber One; occasional users → promos.
- Upselling: Premium rides, priority deliveries, add-ons.
- Cross-selling: Rides → Eats, Eats → Rides, wallet integration.
- Dynamic pricing: AI-driven surges and delivery adjustments.
- Retention: Uber One (19M+ subs), gamified discounts, loyalty rewards.
- LTV optimization: Multi-service users spend 2.5× more monthly.
- Psychological pricing: Anchored discounts, BNPL for groceries, free delivery thresholds.
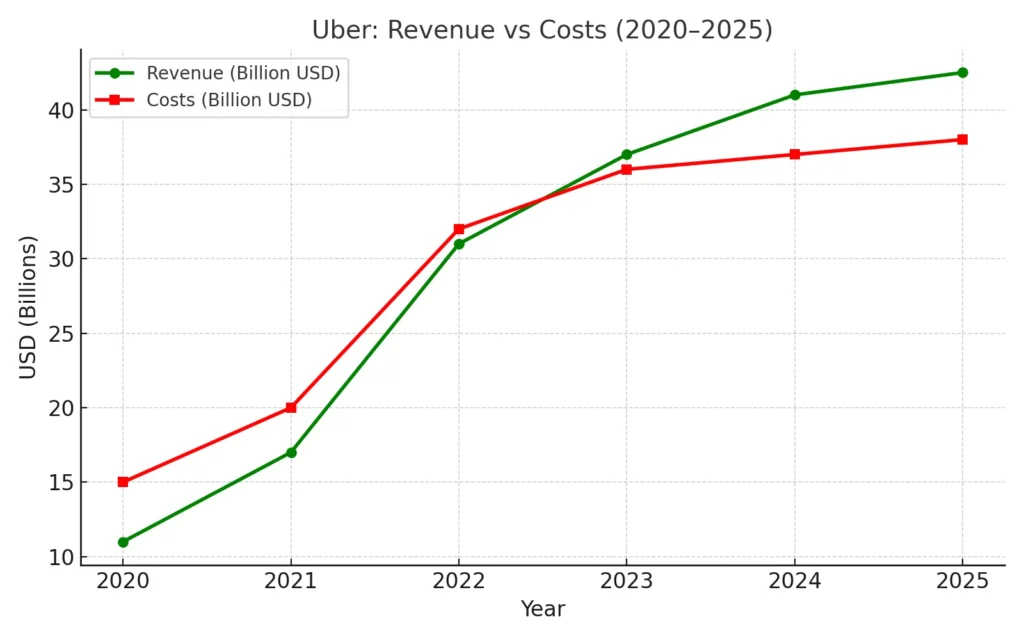
Cost Structure & Profit Margins
Costs:
- Tech infra (cloud, AI, maps).
- Marketing (shift to merchant-funded).
- Operations (incentives, compliance).
- R&D (autonomous, AI, fintech).
Margins:
- Mobility: Highly profitable.
- Eats: Now margin-positive due to ads & subs.
- Freight: Slim, strategic.
- Ads: >70% gross margin.
Profitability path:
- 2023: Adjusted EBITDA positive.
- 2024–25: Sustained net profits ~10–12%.
Learn More: Business Model of Uber in 2025 | Revenue & Founder’s Guide

Future Revenue Opportunities & Innovations
- Ads Expansion: Rides, groceries, in-car ads.
- Uber Health: Healthcare transport + insurance.
- Uber Wallet: Payments, P2P, BNPL.
- AI: Personalized pricing, demand forecasting, ad targeting.
- Autonomous Vehicles: Driverless fleets could transform margins by 2027.
Predictions (2025–2027):
- Ads → $3B+ revenue.
- Fintech → 10%+ share.
- Subscriptions → 25M global members.
Threats: Regulation, competition, defaults in BNPL, autonomous delays.
Opportunities for startups: Hyperlocal delivery, green mobility, SME fintech.
Lessons for Entrepreneurs & Your Opportunity
What works: Diversification, data-driven pricing, fintech & ads.
What to replicate: Commissions → subs → ads → fintech.
What to improve: Focus on unit economics, tiered offerings, ad/UX balance.
Market gaps: SME fintech, tier-2 logistics, niche mobility, eco-focused services.
Miracuves helps entrepreneurs build Uber-inspired platforms with built-in monetization (commissions, subscriptions, ads, fintech).
Some clients earn within 30 days.
Get a free consultation today to map your revenue strategy.
Final Thought
Uber’s 2025 success proves that super-platforms can be profitable when monetization is layered smartly. From rides to Eats to ads and fintech, Uber clone shows how to turn everyday transactions into an ecosystem of recurring revenue.
Entrepreneurs can adapt this model, focusing on unit economics + multi-stream monetization — and with Miracuves, launch faster than ever.
Revenue Model FAQs
1) How much does Uber make per transaction?
20–25% of ride fares, 15–30% of Eats orders, plus service fees.
2) What’s Uber’s most profitable revenue stream?
Advertising and fintech (Uber Ads + Wallet/BNPL).
3) How does Uber’s pricing compare?
Similar to Lyft (rides) and DoorDash (food), but stronger globally.
4) What % does Uber take from providers?
Drivers: 20–25%, Merchants: 15–30%, Freight: 5–10%.
5) How has Uber’s model evolved?
Rides → Eats → Freight → Ads/Fintech, profitable by 2025.
6) Can small platforms use similar models?
Yes, commissions + subs + ads scale down well.
7) Minimum scale for profitability?
Start with commissions → add subscriptions → layer ads & wallet.
8) Alternatives to Uber’s model?
Vertical-focused delivery, e-commerce-first, B2B logistics SaaS.
9) How quickly can platforms monetize?
With the right model and Miracuves’ expertise, you can achieve launch-ready status in just 3–6 days with guaranteed delivery.


