


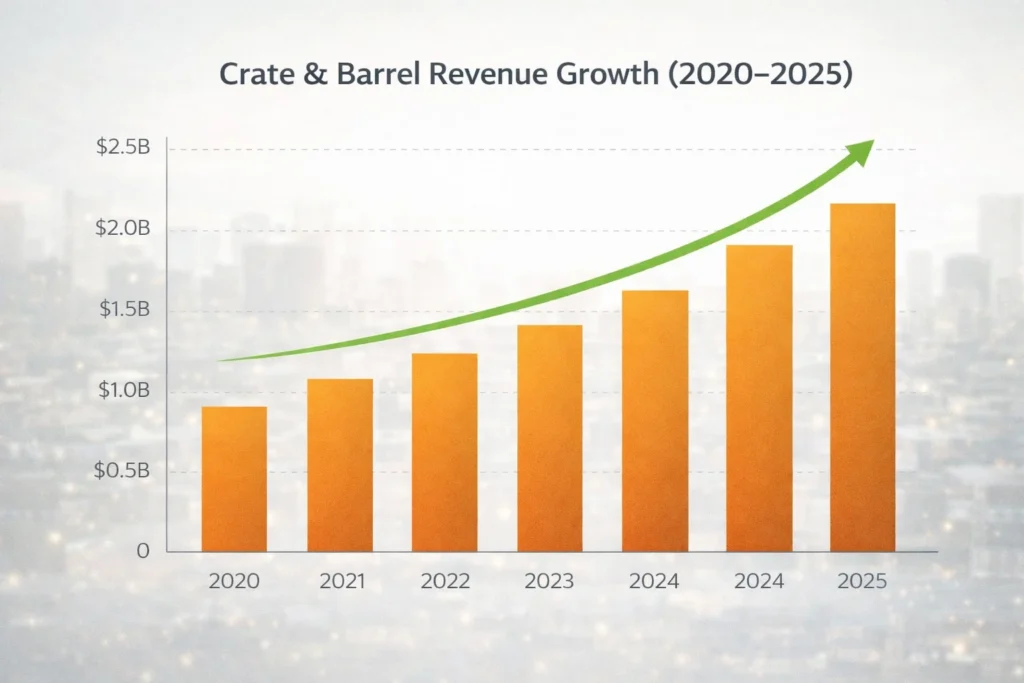
In 2025, Crate & Barrel operates as one of the most profitable premium furniture and home décor brands globally, generating over $2.4 billion in annual revenue. This performance is driven by high average order values, strong repeat purchase behavior, and premium margins supported by exclusive product designs and consistent brand positioning across physical and digital channels.
Unlike pure marketplaces, Crate & Barrel blends direct-to-consumer retail, private-label manufacturing, omnichannel sales, and premium pricing into a highly defensible revenue model. By controlling product design, sourcing, pricing, and customer experience end-to-end, the brand reduces dependency on third-party sellers while capturing higher margins and predictable demand.
For founders, this model shows how design leadership, brand trust, and operational control can outperform discount-led marketplaces. Rather than competing on price, Crate & Barrel demonstrates that experience-driven retail, bundled selling, and long-term customer relationships create more sustainable revenue and profitability over time.
Crate & Barrel Revenue Overview – The Big Picture
Crate & Barrel runs a vertically integrated retail model, owning product design, sourcing, branding, and customer relationships.
2025 Snapshot
- Estimated 2025 Revenue: ~$2.4–2.6 billion
- Valuation (private): ~$6–7 billion (estimated)
- YoY Growth: ~9–11%
- Primary Markets: United States (~75%), International (~25%)
- Average Gross Margin: 45–50%
- Operating Margin: 10–14%
Revenue by Region
- United States: ~75%
- Canada & Europe: ~15%
- Asia & Middle East: ~10%
Competition Benchmark
- IKEA: Higher volume, lower margins
- Wayfair: Marketplace-led, thinner margins
- Crate & Barrel: Brand-led, margin-focused
Read More: What is Crate & Barrel and How Does It Work?
Primary Revenue Streams – Deep Dive
Revenue Stream #1: Direct Furniture & Home Décor Sales
Crate & Barrel earns most of its revenue by selling its own branded products.
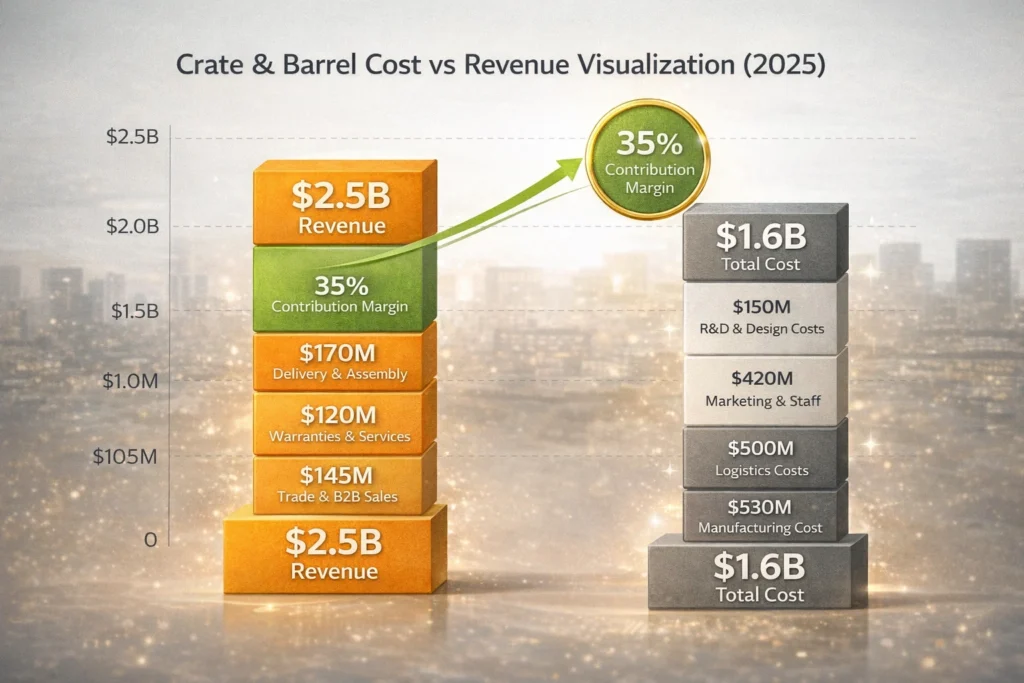
- Revenue Share: ~68%
- Average Order Value (AOV): $350–$900
- 2025 Contribution: ~$1.6B+
- High margins driven by private-label manufacturing.
Revenue Stream #2: Omnichannel Retail (Stores + Online)
Physical stores act as experience centers that drive online conversions.
- Revenue Share: ~14%
- 2025 Contribution: ~$340M
- Customers visiting stores have 2–3× higher lifetime value.
Revenue Stream #3: Delivery, Assembly & Installation Fees
White-glove services generate additional high-margin revenue.
- Revenue Share: ~7%
- Fee Range: $99–$299 per order
- 2025 Contribution: ~$170M
Revenue Stream #4: Trade Program & B2B Sales
Interior designers, hotels, and commercial buyers receive bulk pricing.
- Revenue Share: ~6%
- 2025 Contribution: ~$145M
- Extremely high repeat purchase rates.
Revenue Stream #5: Extended Warranties & Add-on Services
Protection plans and care services increase per-order margins.
- Revenue Share: ~5%
- 2025 Contribution: ~$120M
Revenue Streams Breakdown
| Revenue Stream | % Share |
|---|---|
| DTC Product Sales | 68% |
| Omnichannel Retail | 14% |
| Delivery & Assembly | 7% |
| Trade & B2B Sales | 6% |
| Warranties & Add-ons | 5% |
The Fee Structure Explained
Crate & Barrel focuses on transparent pricing with premium upsells.
Customer-Side Fees
- Product pricing (premium margin built-in)
- Delivery & installation fees
- Warranty & care plans
Supplier-Side Fees
- None (vertically integrated model)
Hidden Revenue Layers
- Bulk manufacturing margin advantages
- Inventory financing efficiency
- Repeat purchase economics
Regional Pricing Variation
- Higher margins in urban markets
- Localized delivery pricing
Fee Structure Table
| User Type | Fee Type | Typical Range |
|---|---|---|
| Customers | Delivery & setup | $99–$299 |
| Customers | Warranty plans | 5–12% of order |
| Trade Buyers | Bulk discounts | Volume-based |
| B2B Clients | Custom pricing | Contract-based |
How Crate & Barrel Maximizes Revenue Per User
Crate & Barrel monetizes experience and trust, not discounts.
- Segmentation: Homeowners, designers, premium renters
- Upselling: Bundled room collections
- Cross-selling: Furniture + décor + lighting
- Dynamic Pricing: Seasonal collections & exclusives
- Retention Monetization: Trade accounts & repeat collections
- LTV Optimization: Design consistency across years
- Psychological Pricing: Premium anchoring over discounts
Real Example (2025):
Customers buying room bundles spend 42% more than single-item buyers.
Cost Structure & Profit Margins
Vertical control gives Crate & Barrel strong margin discipline.
Cost Breakdown
- Manufacturing & sourcing: ~38%
- Logistics & warehousing: ~20%
- Marketing & brand: ~12%
- Operations & retail staff: ~15%
- R&D & design: ~6%
Unit Economics
- Gross margin: This model supports 45–50%
- Contribution margin per order: 28–35%
Profitability Path
- Private-label dominance
- Lower return rates vs marketplaces
Read More: Best Crate-Barrel Clone Scripts 2025 | Furniture E-Commerce App
Future Revenue Opportunities & Innovations
New Revenue Streams
- Subscription home refresh programs
- Smart furniture integrations
- AR/VR home planning tools
AI/ML Monetization
- Personalized room recommendations
- Predictive inventory planning
Market Expansion
- Emerging luxury urban markets
- Hospitality & commercial furniture
2025–2027 Trends
- Experience-led retail
- Sustainable materials premium pricing
- Faster white-glove delivery
Risks
- Inventory holding risk
- Housing market slowdowns
Opportunities for Founders
- Vertical furniture niches
- Region-specific premium brands
Lessons for Entrepreneurs & Your Opportunity
What Works
- Brand-first monetization
- Vertical integration
- Experience-based pricing
What to Replicate
- Private-label control
- Bundled selling strategy
Market Gaps
- Affordable premium furniture
- Digital-first design platforms
Founder Improvements
- Faster customization
- AI-led home visualization
Want to build a platform with Crate & Barrel’s proven revenue model? Miracuves helps entrepreneurs launch revenue-generating platforms with built-in monetization systems. Our Crate & Barrel clone scripts come with flexible revenue models you can customize. In fact, some clients see revenue within 30 days of launch, and if you want it we may arrange and deliver it in 30–90 days.
If you want advanced language-level scripts or enhanced versions, Miracuves provides those too.
Final Thought
Crate & Barrel proves that owning the brand often beats owning the marketplace. By controlling product identity, pricing, and customer experience, the company avoids margin dilution, reduces price competition, and builds stronger emotional connections with buyers—advantages that most open marketplaces struggle to maintain.
Its revenue strength comes from design authority, operational control, and long-term customer trust. Exclusive collections, consistent quality standards, and reliable delivery experiences encourage repeat purchases, higher order values, and lower return rates, all of which compound profitability over time.
For founders, this model shows how premium positioning can unlock sustainable profitability when paired with disciplined execution. Instead of racing to the bottom on price, entrepreneurs can focus on brand differentiation, vertical integration, and experience-led monetization to build resilient, high-margin businesses.
FAQs
1. How much does Crate & Barrel make per order?
Margins vary, but average contribution margin ranges from 28–35%.
2. What’s Crate & Barrel’s most profitable revenue stream?
Private-label furniture sales.
3. How does its pricing compare to competitors?
Higher than marketplaces, justified by quality and service.
4. Does Crate & Barrel charge sellers commission?
No, it sells its own products.
5. How has the revenue model evolved?
From store-led retail to omnichannel dominance.
6. Can small brands use this model?
Yes, especially niche furniture verticals.
7. What’s the minimum scale for profitability?
Typically $10–20M annual GMV with private labels.
8. How to implement similar revenue models?
Start with DTC, then layer experiences and services.
9. What are alternatives to this model?
Marketplace or dropship-led furniture platforms.
10. How quickly can similar platforms monetize?
With the right setup, within the first 30–90 days.