


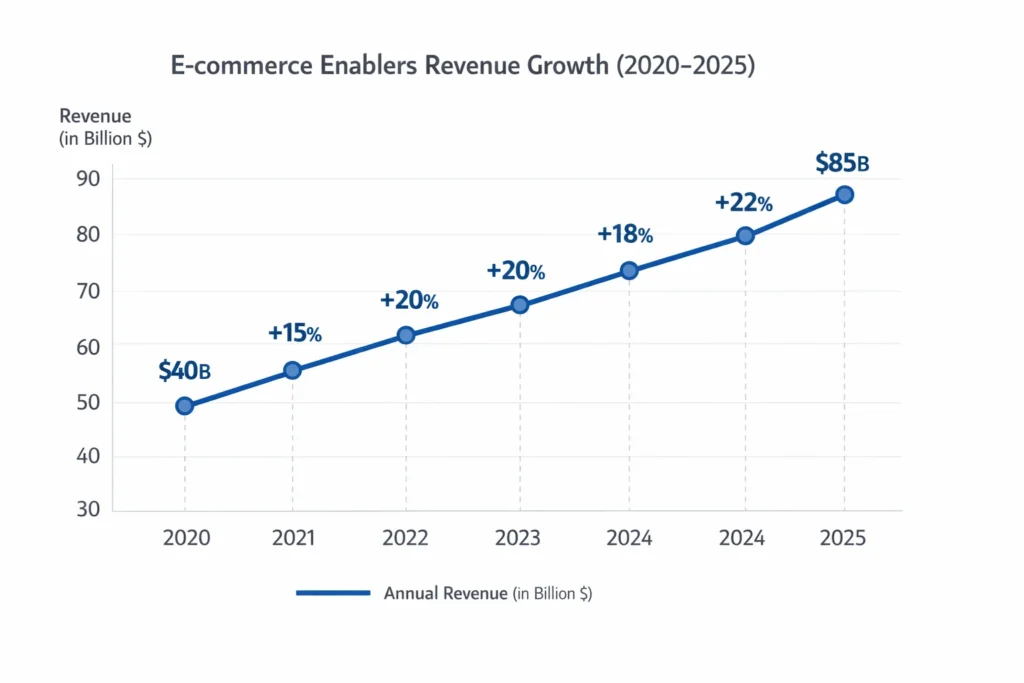
In 2025, E-commerce Enablers collectively generate over $85 billion in global revenue, quietly powering thousands of online brands behind the scenes. From storefront creation to payments, logistics, and growth automation, these platforms sit at the core of modern digital commerce.
Founders studying E-commerce Enablers aren’t just analyzing tools—they’re decoding the infrastructure economy of online retail.
Understanding this revenue model helps entrepreneurs build scalable SaaS, marketplace, and commerce-tech platforms with predictable, recurring income.
E-commerce Enablers Revenue Overview – The Big Picture
E-commerce Enablers include platforms offering storefront tech, payments, fulfillment, analytics, marketing automation, and cross-border commerce services.
2025 Snapshot
- Global Revenue (2025): ~$85–90 billion
- Estimated Market Valuation: ~$450–500 billion (combined public + private)
- YoY Growth (2024–2025): ~18%
- Profit Margins: 18–32% (SaaS-heavy players higher)
Revenue by Region
- North America: ~42%
- Europe: ~26%
- Asia-Pacific: ~24%
- Rest of World: ~8%
Competition Benchmark
- Pure SaaS enablers outperform logistics-heavy players on margins
- Platforms bundling payments + fulfillment show highest ARPU
- Vertical-specific enablers (D2C, B2B, cross-border) grow fastest
Primary Revenue Streams Deep Dive
Revenue Stream #1: SaaS Subscriptions
How it works: Monthly or annual fees for storefronts, integrations, analytics, and automation tools.
Share: ~34%
Pricing: $29–$2,000+/month depending on scale
2025 Insight: Subscription ARPU increased due to bundled AI tools.
Revenue Stream #2: Transaction Fees
How it works: Percentage cut on every sale processed via platform payments.
Share: ~26%
Pricing: 1.5%–3.5% per transaction
2025 Insight: Embedded payments outperform standalone gateways.
Revenue Stream #3: Fulfillment & Logistics Margins
How it works: Warehousing, shipping, returns, and last-mile services.
Share: ~21%
Pricing: Variable per order, weight, and region
2025 Insight: Automation reduced per-order costs by ~12%.
Revenue Stream #4: Value-Added Services
How it works: Marketing tools, loyalty engines, tax compliance, fraud protection.
Share: ~11%
Pricing: Add-on based or usage-based
2025 Insight: High-margin upsell layer for mature merchants.
Revenue Stream #5: Data & Partner Monetization
How it works: Insights, benchmarks, API access, app marketplaces.
Share: ~8%
Pricing: Revenue share or enterprise licensing
2025 Insight: AI-driven insights increased enterprise demand.
Revenue Streams Percentage Breakdown
| Revenue Stream | % Share (2025) |
|---|---|
| SaaS Subscriptions | 34% |
| Transaction Fees | 26% |
| Fulfillment & Logistics | 21% |
| Value-Added Services | 11% |
| Data & Partnerships | 8% |
The Fee Structure Explained
E-commerce Enablers monetize both sides of the ecosystem—merchants and service providers.
User-Side Fees (Merchants)
- Platform subscription fees
- Transaction processing fees
- Add-on service charges
- Usage-based API fees
Provider-Side Fees
- Revenue share from third-party apps
- Fulfillment partner commissions
- Advertising placement fees
Hidden Revenue Layers
- Float income on settlements
- FX margins on cross-border sales
- AI optimization premium features
Regional Pricing Variation
- Higher pricing tolerance in North America & EU
- Usage-based dominance in Asia
- Bundled pricing in emerging markets
Complete Fee Structure by User Type
| User Type | Fee Type | Typical Range |
|---|---|---|
| Small Merchants | SaaS + transaction | $29–$79 + 2–3% |
| Mid-Market Brands | SaaS + services | $299–$2,000/month |
| Enterprise Merchants | Custom licensing | $50k–$500k/year |
| App Developers | Revenue share | 15–30% |
| Logistics Partners | Commission | 5–12% |
How E-commerce Enablers Maximize Revenue Per User
Revenue growth is driven by LTV expansion, not just user acquisition.
- Segmentation: SMB, D2C, enterprise, cross-border sellers
- Upselling: AI tools, analytics, advanced checkout
- Cross-selling: Payments → fulfillment → marketing
- Dynamic Pricing: Volume-based and geography-based
- Retention Monetization: Long-term contracts, switching costs
- LTV Optimization: Bundled ecosystems increase LTV by 2–3×
- Psychological Pricing: Tiered plans anchor value
- Real Data Example: Merchants using 4+ services generate ~2.6× ARPU vs single-tool users
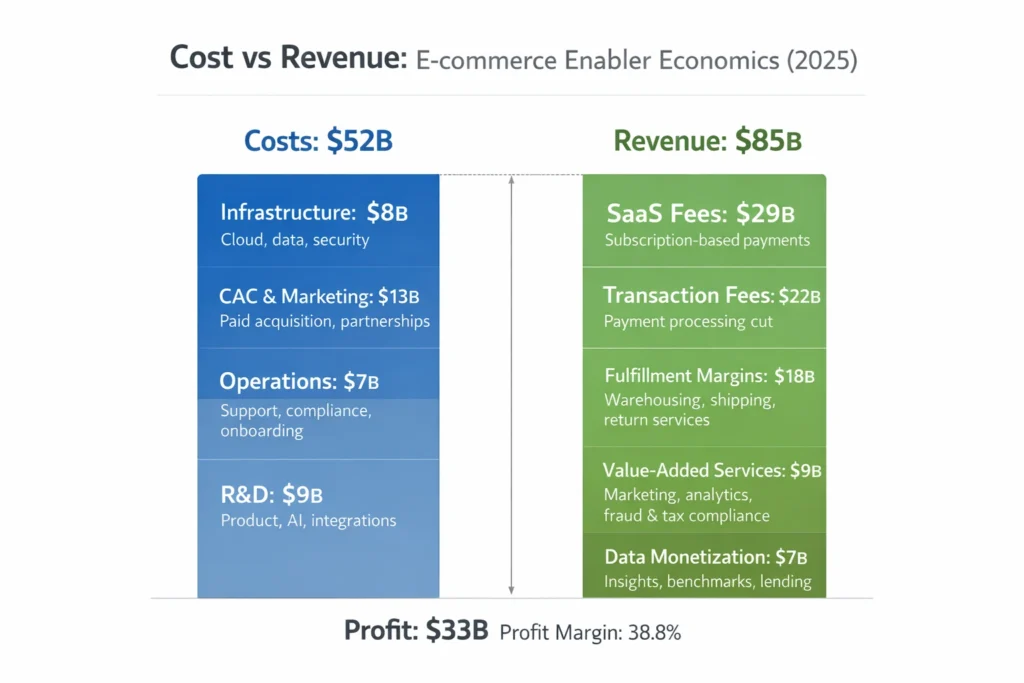
Cost Structure & Profit Margins
Despite scale advantages, cost discipline defines profitability.
Major Cost Buckets
- Infrastructure: Cloud, data, security (~14–18%)
- CAC & Marketing: Paid acquisition, partnerships (~20–25%)
- Operations: Support, compliance, onboarding (~12–15%)
- R&D: Product, AI, integrations (~10–14%)
Unit Economics
- Gross margin (SaaS): 70–85%
- Gross margin (logistics): 18–30%
Profitability Path
- Break-even at ~3,000–5,000 active merchants
- Margin expansion via automation and AI
Future Revenue Opportunities & Innovations
New Streams
- Embedded lending & working capital
- Creator-commerce infrastructure
- Social commerce integrations
AI/ML Monetization
- Predictive inventory pricing
- Conversion-rate optimization engines
- AI customer support upsells
Market Expansion
- Cross-border enablement
- B2B commerce tooling
- Emerging market digitization
Predicted Trends (2025–2027)
- Commerce OS platforms dominate
- Payments + data converge
- Fewer tools, deeper platforms
Risks & Threats
- Margin pressure in logistics
- Regulatory complexity
- Platform dependency concerns
Opportunities for New Founders
- Vertical-specific enablers
- Region-focused solutions
- AI-first commerce stacks
Lessons for Entrepreneurs & Your Opportunity
What Works
- Recurring SaaS + transactional revenue
- Ecosystem lock-in
- Bundled value delivery
What to Replicate
- Multi-layer monetization
- Usage-based scaling
- Partner marketplaces
Market Gaps
- Affordable enterprise-grade tools for SMBs
- Unified cross-border stacks
- AI-native commerce platforms
Want to build a platform with E-commerce Enablers’ proven revenue model? Miracuves helps entrepreneurs launch revenue-generating platforms with built-in monetization systems. Our E-commerce Enabler-style platforms come with flexible revenue models you can customize. In fact, some clients see revenue within 30 days of launch, andif you want it we may arrange and deliver it in 30–90 days.
If you want advanced language-level scripts or enhanced versions, Miracuves provides those too.
Final Thought
E-commerce Enablers are no longer tools—they are digital infrastructure businesses.
Their success comes from stacking monetization layers while simplifying commerce for merchants.
For founders, this model offers one of the clearest paths to scalable, defensible, and recurring revenue in the digital economy.
FAQs
1. How much do E-commerce Enablers make per transaction?
Typically 1.5%–3.5% depending on volume and region.
2. What’s the most profitable revenue stream?
SaaS subscriptions and AI add-ons deliver the highest margins.
3. How does pricing compare to competitors?
Bundled platforms offer better value but higher long-term spend.
4. What percentage is taken from providers?
App and partner revenue shares range from 15–30%.
5. How has the revenue model evolved?
From tools → ecosystems → AI-powered platforms.
6. Can small platforms use similar models?
Yes, by starting with SaaS + transactions.
7. What’s the minimum scale for profitability?
Around 3,000–5,000 active merchants.
8. How to implement similar revenue models?
Combine subscriptions, usage fees, and ecosystem partnerships.
9. What are alternatives to this model?
Pure SaaS, marketplace-only, or logistics-only platforms.
10. How quickly can similar platforms monetize?
Many begin generating revenue within the first 30–60 days.