


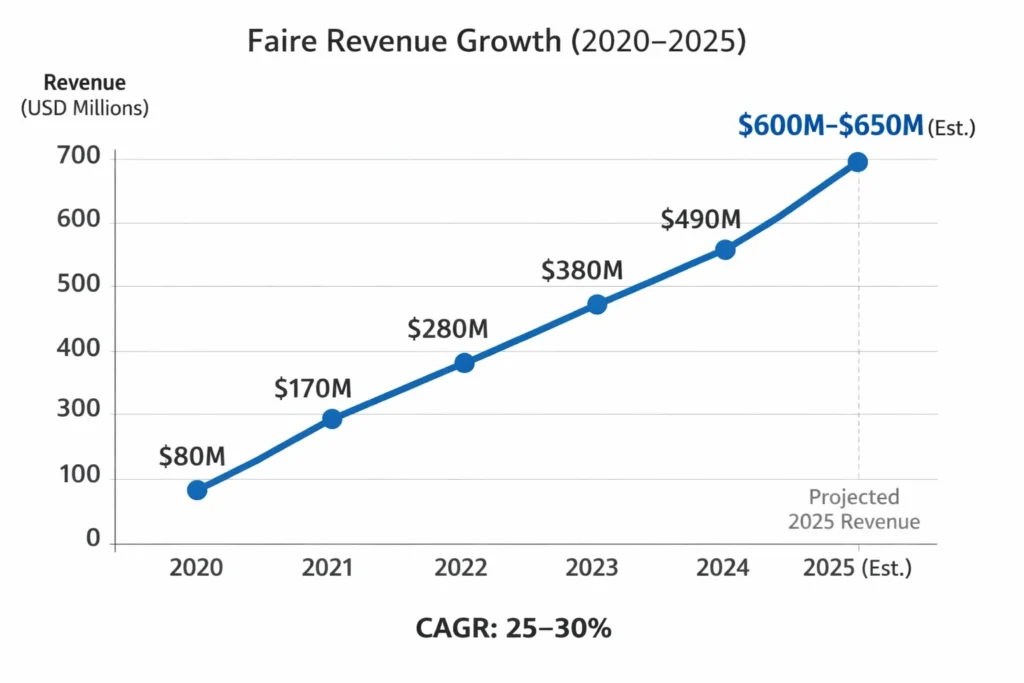
Faire crossed $600 million in annual revenue by 2025, making it one of the most powerful B2B wholesale marketplaces globally. Its rapid growth is driven by strong network effects, deep brand–retailer integration, and a revenue model that scales with transaction volume rather than user subscriptions.
For founders, Faire is not just a marketplace story—it’s a masterclass in monetizing supply-side networks without charging buyers upfront. By shifting fees to brands, layering logistics and financing, and eliminating buyer friction, Faire accelerates adoption while maintaining healthy long-term unit economics.
Understanding Faire’s revenue model helps entrepreneurs design scalable, capital-efficient B2B platforms with predictable margins. The model demonstrates how commissions, embedded finance, and value-added services can work together to build defensible revenue streams without slowing marketplace growth.
Faire Revenue Overview – The Big Picture
- 2025 Revenue: ~$600–650 million (estimated from transaction volumes & commission disclosures)
- Valuation: ~$13 billion (private market valuation)
- YoY Growth: ~25–30% CAGR
- Revenue by Region:
- North America: ~68%
- Europe: ~22%
- Rest of world: ~10%
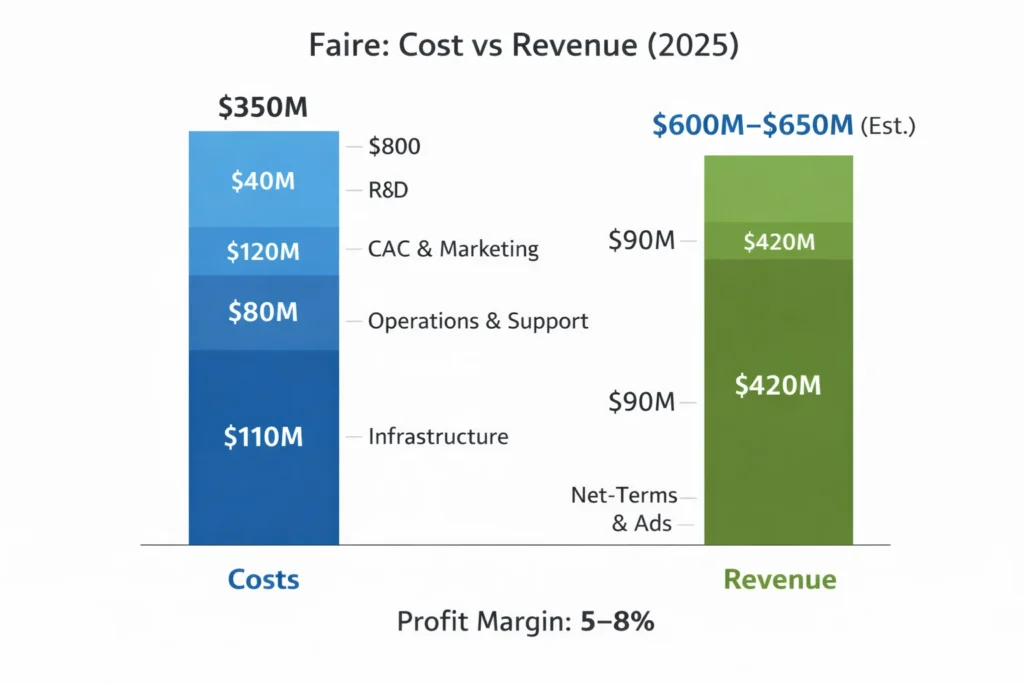
- Profit Margins: Net margins currently thin (5–8%) due to logistics & credit costs
- Competition Benchmark:
- Faire outpaces traditional wholesale distributors on growth
- Competes with Tundra, Ankorstore, Alibaba Wholesale
Read More: What is Faire and How Does It Work?
Primary Revenue Streams Deep Dive
Revenue Stream #1: Wholesale Commission Fees
- How it works: Faire takes a cut from every successful wholesale order
- Commission: ~15–25% depending on order type
- Share of Revenue: ~70%
- 2025 Insight: Commission revenue alone exceeds $420M annually
Revenue Stream #2: Logistics & Shipping Fees
- Faire manages fulfillment for many orders
- Earns margin on negotiated carrier rates
- Share: ~12–15%
Revenue Stream #3: Financial Services (Net Terms)
- Retailers get Net 30 / Net 60 payment terms
- Faire earns via financing spreads & risk pricing
- Share: ~8–10%
Revenue Stream #4: Advertising & Brand Boosts
- Brands pay for higher visibility inside marketplace
- Sponsored listings and featured placements
- Share: ~4–6%
Revenue Stream #5: International Expansion Fees
- Cross-border handling, FX spreads, compliance fees
- Share: ~3–5%
Revenue streams percentage breakdown
| Revenue Stream | How It Generates Money | Percentage Share |
|---|---|---|
| Wholesale Commission Fees | Percentage cut on every wholesale transaction | 70% |
| Logistics & Shipping Margins | Margin on negotiated carrier and fulfillment costs | 14% |
| Embedded Financing (Net 30 / Net 60) | Interest spreads and risk-adjusted financing fees | 9% |
| Advertising & Brand Promotions | Sponsored listings and featured placements | 5% |
| Cross-Border & FX Fees | International handling, compliance, and FX margins | 2% |
| Total | 100% |
The Fee Structure Explained
User-Side Fees (Retailers)
- No upfront subscription
- Free browsing & ordering
- Late payment penalties (where applicable)
Provider-Side Fees (Brands)
- Commission per order (15–25%)
- Shipping & fulfillment fees
- Advertising fees
Hidden Revenue Layers
- Financing spreads
- Carrier discounts margin
- FX conversion margin
Regional Pricing Variation
- Lower commissions in Europe to drive adoption
- Higher logistics margins in North America
Complete fee structure by user type
| User Type | Fee Category | What They Pay | Typical Range (Global Market) | When It Applies | Notes (Revenue Logic) |
|---|---|---|---|---|---|
| Retailers (Buyers) | Platform access | Usually $0 | $0 | Always | “Free-to-buy” removes friction and drives demand |
| Retailers (Buyers) | Product price | Wholesale product cost | Varies by category | Per order | Retailers pay the supplier’s wholesale rate |
| Retailers (Buyers) | Shipping (sometimes) | Shipping cost or portion | Often subsidized / negotiated | Per shipment | Logistics can be priced into product or charged separately |
| Retailers (Buyers) | Net terms / financing | Financing cost (if using Net 30/60) | Typically ~0–3% equivalent depending on risk/terms | When net terms are used | Monetized via interest spread / risk pricing |
| Retailers (Buyers) | Late payment fee | Penalty fees | Varies by region & policy | If overdue | Small but meaningful “discipline” revenue |
| Brands (Sellers/Providers) | Commission (core) | % cut on orders | 15–25% | Per completed order | Primary revenue engine |
| Brands (Sellers/Providers) | New customer acquisition fee | Higher commission on first-time retailer orders | Often within 15–25% band | When platform brings new retailers | Monetizes demand generation |
| Brands (Sellers/Providers) | Returning customer fee | Reduced commission for repeat buyers | Lower end of the band | For repeat retailer orders | Encourages retention & long-term sellers |
| Brands (Sellers/Providers) | Logistics / fulfillment fees | Shipping / warehousing / handling charges | Cost + margin | When using platform logistics | Adds a second margin layer on top of commission |
| Brands (Sellers/Providers) | Payment processing layer | Transaction processing fees (where applicable) | Small % / fixed fee | Per transaction | Can be bundled or shown separately |
| Brands (Sellers/Providers) | Advertising / promotions | Sponsored listings, featured placement | Bid-based / fixed packages | Optional | High-margin monetization lever |
| Brands (Sellers/Providers) | Cross-border / FX | Currency conversion & international handling | ~1–3% FX spread + handling | For international orders | Hidden but scalable revenue layer |
| Platform (Internal) | Risk pricing (hidden) | Credit risk & default pricing | Embedded in financing economics | When offering net terms | Determines profitability of net terms business |
| Platform (Internal) | Dynamic commission pricing | Commissions vary by category & seller tier | Adjusted over time | Ongoing | Optimizes LTV and reduces churn |
How Faire Maximizes Revenue Per User
- Segmentation:
New brands vs established brands vs enterprise sellers - Upselling:
Sponsored placements & analytics tools - Cross-selling:
Logistics + financing bundled with orders - Dynamic Pricing:
Commission adjustments based on brand maturity - Retention Monetization:
Brands stay due to retailer demand lock-in - LTV Optimization:
Average brand lifetime exceeds 4.5 years - Psychological Pricing:
“Free for retailers” removes friction entirely - Real Data Example:
Top brands generate $200k–$500k GMV annually on Faire
Cost Structure & Profit Margins
Infrastructure Cost
- Cloud hosting
- Marketplace architecture
- Data & ML systems
CAC & Marketing
- Heavy brand acquisition spend
- Retailer onboarding incentives
Operations
- Logistics partnerships
- Customer support
- Risk & fraud teams
R&D
- AI-based product discovery
- Credit risk engines
Unit Economics
- Gross margin per order: ~35%
- Net margin after costs: ~5–8%
Profitability Path
- Higher margins expected as financing & ads scale
Read More: Best Faire Clone Script 2025 | Scalable B2B Wholesale Marketplace
Future Revenue Opportunities & Innovations
- AI-driven product recommendations monetization
- Embedded lending for brands
- Private label manufacturing services
- Expansion into LATAM & Asia
- Predictive demand analytics for retailers
Predicted Trends (2025–2027):
- Financing revenue may double
- Ad revenue grows faster than commissions
Risks & Threats
- Credit defaults
- Logistics cost volatility
- Platform disintermediation
Opportunities for New Founders
- Vertical-specific wholesale marketplaces
- Localized B2B networks
- Faster payout alternatives
Lessons for Entrepreneurs & Your Opportunity
What Works
- Zero buyer friction
- Monetize the supply side
- Strong financing hooks
What to Replicate
- Commission + value-added services
- Embedded finance
- Network effects
Market Gaps
- Emerging market wholesalers
- Industry-specific platforms
Improvements Founders Can Use
- Lower commission tiers
- Faster settlements
- AI-first onboarding
Want to build a platform with Faire’s proven revenue model? Miracuves helps entrepreneurs launch revenue-generating platforms with built-in monetization systems. Our Faire clone scripts come with flexible revenue models you can customize. In fact, some clients see revenue within 30 days of launch, and if you want it we may arrange and deliver it in 30–90 days.
if you want it we may arrange and deliver it in 3–9 days.
If you want advanced language-level scripts or enhanced versions, Miracuves provides those too.
Final Thought
Faire proves that B2B marketplaces can scale faster than B2C when buyer friction is completely removed. By offering free access to retailers and focusing monetization on suppliers, Faire accelerates demand, increases order frequency, and strengthens network effects across the platform.
Its revenue model shows how commissions, embedded finance, and logistics services compound into durable, multi-layered income streams. Each layer increases revenue per transaction while improving retention, making the business more resilient to pricing pressure and competition.
For founders, the opportunity lies in replicating the structure while specializing the market. Vertical-focused wholesale platforms, regional networks, or niche supplier ecosystems can apply the same model with lower competition and faster paths to profitability.
FAQs
1. How much does Faire make per transaction?
Typically 15–25% of order value.
2. What’s Faire’s most profitable revenue stream?
Wholesale commissions.
3. How does Faire’s pricing compare to competitors?
Higher than traditional distributors, but justified by reach and financing.
4. What percentage does Faire take from providers?
Between 15% and 25%.
5. How has Faire’s revenue model evolved?
From pure commission to finance- and ads-driven monetization.
6. Can small platforms use similar models?
Yes, especially in niche verticals.
7. What’s the minimum scale for profitability?
~$50–100M GMV annually.
8. How to implement similar revenue models?
Start with commissions, then layer logistics and finance.
9. What are alternatives to Faire’s model?
Subscription-based wholesale or SaaS-driven procurement.
10. How quickly can similar platforms monetize?
Many businesses begin generating revenue soon after launch.