


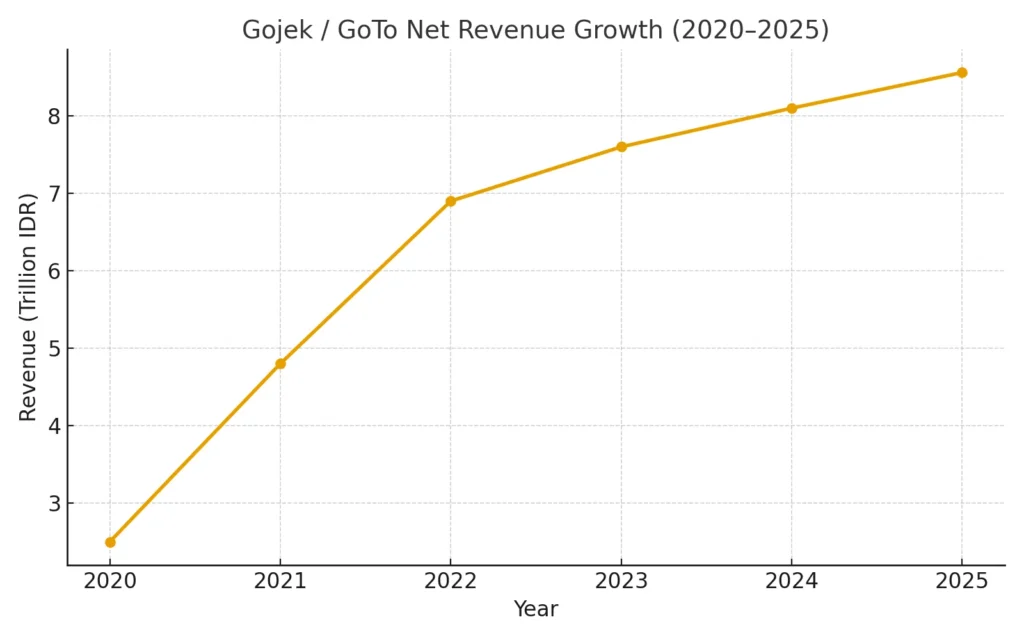
Gojek (under the GoTo group) reported Rp 4.32 trillion in net revenue in Q2 2025 — up ~18% year-on-year. In the first half of 2025, its revenue reached Rp 8.56 trillion, significantly narrowing losses and producing positive adjusted EBITDA.
For entrepreneurs, dissecting Gojek’s revenue model is a masterclass in how a “super-app” weaves together mobility, food delivery, logistics, and fintech into a monetization engine. You’ll see not just what revenue streams they use, but how these can inspire new platform ideas — especially at Miracuves.
Gojek Revenue Overview — The Big Picture
Current Valuation & Revenue (Latest Data)
- In Q2 2025, GoTo (the parent company of Gojek + Tokopedia + GoTo Financial) reported a net revenue of IDR 4,328 billion (≈ Rp 4.32 trillion), up ~18–23% YoY depending on presentation pro forma.
- For the first half of 2025 (H1 2025), net revenue reached IDR 8,559 billion (≈ Rp 8.56 trillion), up ~11% from H1 2024.
- As of June 30, 2025, GoTo held IDR 18.2 trillion in cash, cash equivalents, and short-term deposits.
- The company also reported positive Adjusted EBITDA in Q2 2025 of IDR 427 billion, marking a significant turnaround from negative EBITDA in prior periods.
- In Q2 2025, the group also posted positive (reported) EBITDA of IDR 292 billion.
- The net loss for Q2 2025 narrowed to IDR (375) billion, down from about IDR (1,909) billion in Q2 2024 — an ~80% improvement.
- For H1 2025, net loss was IDR (742) billion, versus (2,846) billion the previous year — a ~74% narrowing.
From these, we see that GoTo is scaling revenue, gaining operating leverage, and moving toward sustainable profitability.
Year-over-Year Growth & Trajectory
- Core GTV (Gross Transaction Value) in Q2 2025 was IDR 89,759 billion, up 43% YoY from IDR 62,935 billion.
- The broader GTV (including all transactions across the group) was IDR 152,873 billion in Q2 2025, up 26% YoY.
- On the revenue side, net revenue grew ~23% YoY in Q2 2025 as per some disclosures.
- The adjusted EBITDA swing from negative to positive is a major inflection: Q2 2024 had negative adjusted EBITDA (≈ –85 billion) vs. Q2 2025 at +427 billion.
- The profit improvement is driven by both top-line growth and cost discipline.
This suggests GoTo is entering a phase of scaling up margins, not just expanding size.
Read More: Build an app like Gojek | Best Gojek Clone with Node.js or Laravel
Revenue by Region & Segment (Geographic Breakdown)
GoTo’s disclosures focus more on business verticals than sharply on geography, but some cues emerge:
- The primary region is Indonesia, where Gojek, Tokopedia, and GoPay are deeply entrenched.
- There has been contraction or exit from some foreign markets; for instance, Gojek had earlier operations in Vietnam, but those have been scaled back. (See Gojek’s Wikipedia for geographic footprint context.)
- GoTo’s “core GTV” metric excludes some cross-border or peripheral revenue, meaning the bulk of revenue is domestic Indonesia.
- Because Indonesia is the single dominant market, geographic growth focuses less on regional splits and more on saturating underserved Indonesian regions (cities, rural areas, islands).
Thus, for revenue modeling, think of GoTo primarily as a dominant Indonesia super-app, with optional expansion plays.
Profit Margins & Operating Leverage
- In Q2 2025, GoTo’s Adjusted EBITDA was IDR 427 billion, turning positive.
- The EBITDA (non-adjusted) was IDR 292 billion in Q2 2025.
- The profit (loss) improvement suggests that GoTo is converting fixed costs and scale into margin gains.
- According to the Q2 2025 call transcript, GoTo’s gross profit margin is ~54.07%.
- Operating leverage is improving thanks to cost controls — e.g. GoTo completed a cloud migration that is expected to reduce annual cloud expenses by more than 50%.
- Also, GoTo’s business mix is shifting: the financial services / lending / payments segment is growing at much faster rates and generating higher-margin revenue than the more capital-intensive on-demand (rides, delivery) segment.
So while on-demand services may remain lower margin, the growth in fintech helps the overall margin profile.
Market Position & Competitive Landscape
- GoTo (via Gojek) is one of the dominant super-apps in Southeast Asia, alongside players like Grab and Sea (Shopee) leveraging adjacent ecosystems.
- In Indonesia’s ride-hailing & food delivery market, GoTo competes with Grab (present in SEA), Shopee (via ShopeeFood), and local incumbents. The fight is intense.
- GoTo’s integrated vertical (mobility + food + logistics + payments) gives it a flywheel advantage: more transactions → more data → better targeting of lending, promotions, fintech.
- Its move to positive EBITDA is an inflection point for credibility in capital markets and competition.
- Some speculative merger talks with Grab (as of 2025) surface in news, though nothing confirmed.
- In 2024, GoTo posted its first full-year underlying profit (adjusted EBITDA), recording ~IDR 327 billion, after years of losses.
Hence, GoTo is transitioning from aggressive growth-at-all-costs to building scalable profitability — a key signal to entrepreneurs watching super-app monetization.
Primary Revenue Streams — Deep Dive (Gojek / GoTo)
Below I break down Gojek’s Clone 2025 revenue engine inside GoTo by stream, with the latest reported numbers for Q2 2025.
Revenue Stream #1: On-Demand Delivery (GoFood, GoSend, etc.)
- How it works: Customers pay for food, groceries, parcels; Gojek earns via take rates/commission, delivery fees, and growing in-app ads sold to merchants (e.g., Masthead, Partner Ads/Jem)
- % of total revenue (Q2’25): ≈ 52% of group net revenue (IDR 2,260 bn of IDR 4,328 bn total).
- Pricing / rates: Platform take rate not disclosed by product, but GoTo’s group net take rate ~2.9–3.0% in 2025 forecasts; Delivery’s effective take is higher than Mobility due to merchant commissions and ads layered on top.
- Growth trends: Delivery core GTV +9% YoY; ODS net revenue +13% YoY in Q2’25; Premium Food segment GTV up +157% YoY; ads as % of Food GMV rising (~1.0% → ~1.8%).
- Real example: Q2’25 ODS (Mobility+Delivery) net revenue IDR 2,987 bn; Delivery portion IDR 2,260 bn; ODS Adjusted EBITDA IDR 328 bn (record), reflecting better unit economics.
Revenue Stream #2: Financial Technology (GoPay payments, GoPayLater lending, merchant services)
- How it works:
- Payments: wallet and processing fees on/ off-platform.
- Credit: GoPayLater / GoPay Pinjam generate interest, fees, and revenue-share via channeling partners (on- and off-balance-sheet).
- Ecosystem tie-ups: Telkomsel Wallet by GoPay; TikTok integrations (e.g., data packs, in-app lending access).
- % of total revenue (Q2’25): ≈ 31% (IDR 1,356 bn).
- Pricing / rates: Not broken out line-by-line publicly; overall Fintech net revenue +76% YoY with Adjusted EBITDA turning positive (IDR 88 bn)—a margin tailwind vs. on-demand.
- Growth trends: Fintech Core GTV +46% YoY, MTUs +29% YoY; consumer loan book +90% YoY with 9th straight quarter of growth; GoPay app driving 2.4× transactions per user since launch.
- Real example: Q2’25 Fintech net revenue IDR 1,356 bn; segment now a key cotributor to GoTo’s Q2 Adjusted EBITDA +IDR 427 bn at group level.
On-Demand Mobility (GoRide, GoCar)
- How it works: Riders pay fares; Gojek keeps a commission (take rate) and certain fees; dynamic pricing balances demand/supply.
- % of total revenue (Q2’25): ≈ 17% (IDR 727 bn).
- Pricing / rates: Per-trip commissions are not disclosed in filings; public discourse/analyst work often references lower take rates than Delivery. (Regulatory talks about caps appear in media, but company filings don’t state a cap; we rely on reported segment outcomes.)
- Growth trends: Mobility GTV +10% YoY in Q2’25; ODS (Mobility+Delivery) Adjusted EBITDA as % of GTV improved to ~2.0% from ~0.6% a year ago, reflecting scaling and cost control.
- Real example: Q2’25 Mobility net revenue IDR 727 bn on GTV IDR 6,047 bn.
(Cross-stream) Advertising & Merchant-Funded Promotions (within Delivery)
- How it works: Sponsored placements (Masthead, Partner Ads/Jempolan), merchant bidding, and merchant-funded promos to boost visibility and orders.
- Why it matters: High-margin add-on inside Delivery; ads as % of Food GMV trending up (~1.8% latest marker).
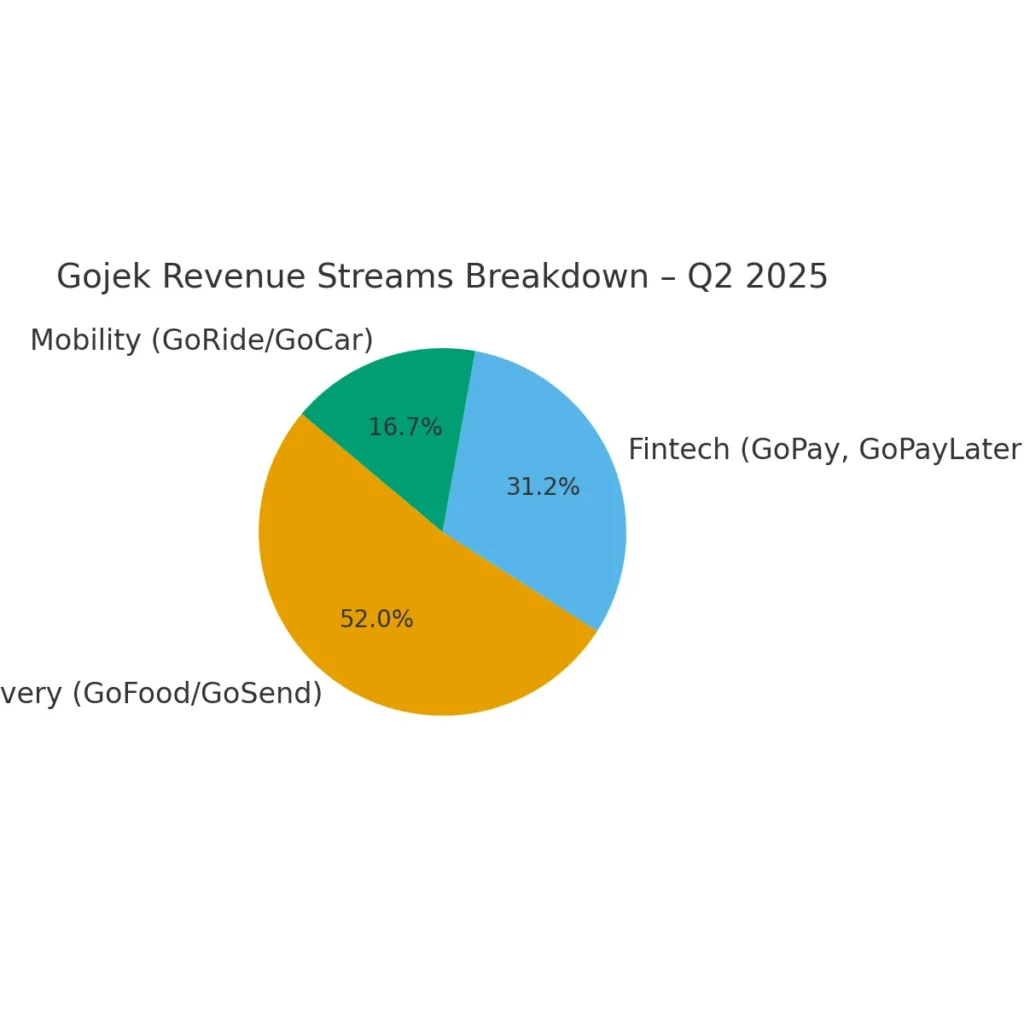
Q2 2025 Revenue Mix (approx., as reported)
| Stream | Net Revenue (IDR bn) | Share of Total |
|---|---|---|
| Delivery (GoFood/GoSend etc.) | 2,260 | ~52% |
| Financial Technology (GoPay, GoPayLater, merchant services) | 1,356 | ~31% |
| Mobility (GoRide/GoCar) | 727 | ~17% |
| Total (Group) | 4,328 | ~100% |
Notes: Segment figures are “as reported” in the 2Q25 Earnings Presentation; minor rounding/aggregation differences mean segment sums can be a touch above the group total—shares shown are approximations of group net revenue.
The Fee Structure Explained (Gojek / GoTo)
Understanding how Gojek charges both users and providers reveals why its monetization is so effective. The company blends commissions, service fees, and fintech charges to maximize take rates while balancing affordability.
User-Side Fees
- Service Fees
- In food delivery (GoFood), users pay delivery fees that vary by distance, demand, and city zone.
- Surge pricing in Mobility (GoRide/GoCar) increases per-trip fares during peak demand.
- Subscription Costs
- Gojek offers GoFood Plus (subscription with free/discounted deliveries, exclusive promos).
- GoPayLater has repayment plans where interest/fees are passed to users.
- Premium Features
- Faster delivery or premium cars (GoCar XL/Executive) cost more.
- In-app value-added services (priority booking, insurance add-ons) create incremental revenue.
Provider-Side Fees
- Commission Rates
- Food delivery merchants: Gojek typically takes 15–20% commission on each transaction (varies by merchant type and agreements).
- Drivers (GoRide, GoCar): Gojek retains a percentage cut (commission) from each fare, historically 10–20% in Indonesia (regulatory guidelines limit overcharging).
- Listing & Visibility Fees
- Restaurants and merchants can pay for ad slots (Masthead, Partner Ads/Jempolan).
- This is a high-margin add-on, boosting GMV without delivery cost.
- Transaction Charges
- For GoPay merchant payments, GoTo applies MDR (merchant discount rates) similar to card processors.
- GoPayLater charges include interest spreads, late fees, and financing margins shared with lending partners.
Hidden Revenue Tactics
- Merchant-funded promotions: Restaurants pay subsidies for discounts, which simultaneously grow order volume and lock users in.
- Cross-selling fintech: Encouraging users to borrow/pay later creates additional fee layers beyond standard transaction commissions.
- Dynamic take rates: Effective take rate can rise in categories like premium food or high-demand areas.
Regional Pricing Variations
- Urban vs Rural: Delivery fees in Jakarta or Surabaya are higher than in smaller towns due to demand density.
- Regulation: Indonesia’s transport ministry sets minimum and maximum fares for motorcycle taxis (GoRide) — this caps flexibility compared to global ride-hailing markets.
- Market competition: Where Grab is strong, Gojek discounts more aggressively, lowering effective fees temporarily.
Fee Structure Table (By User Type)
| User Type | Fee Types | Typical Range (Indonesia, 2025) |
|---|---|---|
| Customer | Delivery fees, surge fares, subscription (GoFood Plus), GoPayLater interest | Delivery Rp 5k–20k; Surge 1.2×–2.0×; GoFood Plus ~Rp 49k/month |
| Driver | Platform commission (cut from fares), incentives/penalties | ~10–20% per trip (regulated bands) |
| Merchant | Transaction commission, ad/visibility fees, promo co-funding | 15–20% take rate; ad spend 1–2% of GMV |
| Fintech Users | Interest, late fees, repayment spreads | Effective APR varies; consumer loan book +90% YoY (2025) |
This multi-layer fee structure ensures that Gojek isn’t just earning once per order — it captures value across delivery, payment, credit, and advertising.
How Gojek Maximizes Revenue Per User
Gojek doesn’t just scale by volume — it extracts more value from every active user through segmentation, cross-sells, and retention levers. Here’s how it works in 2025.
User Segmentation Strategy
- Gojek divides customers into high-frequency users (daily commuters, frequent food orders) and occasional users.
- High-frequency users are nudged toward subscriptions (GoFood Plus, GoPayLater), while occasional users see heavier discounts/promos to increase activity.
- Merchants are segmented into premium dining, mass-market, and SMEs, with tailored ad packages and commission structures.
Upselling Techniques
- Mobility: Riders are encouraged to upgrade from GoRide (bike) to GoCar, GoCar XL, or GoCar Executive with comfort and safety messaging.
- Food Delivery: Customers get recommendations for larger basket orders (combo meals, bundle offers).
- GoPayLater: Instead of paying instantly, users are upsold to flexible credit terms, increasing ticket size and transaction frequency.
Cross-Selling Methods
- Food + Mobility: Order food via GoFood, then book GoRide to pick it up at the same time.
- Fintech tie-ins: Every transaction encourages wallet reloads (GoPay) or credit (GoPayLater), embedding fintech usage in daily behavior.
- Tokopedia synergy: Within the GoTo ecosystem, Gojek nudges users into e-commerce checkout with GoPay or delivery handled by GoSend.
Dynamic Pricing Algorithms
- Surge pricing in GoRide/GoCar ensures maximum revenue during high demand periods.
- Delivery fees adjust dynamically based on driver availability, distance, and order density.
- Fintech APRs vary by user risk profile, with AI models optimizing for default risk vs. revenue.
Retention Monetization
- Loyalty programs (GoClub) reward repeat usage with points, vouchers, and cashback — locking users in.
- Merchant-funded promos give discounts to customers but are paid for by restaurants, protecting Gojek’s margins.
- Continuous gamification (badges, challenges, streak rewards) keeps DAUs high.
Lifetime Value Optimization
- A typical Gojek user touches multiple verticals: ride-hailing, food delivery, wallet, lending.
- By ensuring users engage across 3+ services, LTV multiplies 2–3× compared to single-service users.
- Example: A GoPayLater user who orders food 10× a month can generate >Rp 300k monthly in revenue contribution, compared to <Rp 50k from a basic GoRide-only user.
Psychological Pricing Tricks
- Free delivery thresholds (e.g., “Add Rp 15k more for free delivery”) boost basket size.
- Visible crossed-out prices anchor customers into believing they’re saving big.
- Micro-installments on GoPayLater make even premium meals look affordable, increasing order frequency.
Real Example (2025)
- Q2 2025: Fintech MTUs grew +29% YoY; consumer loan book +90% YoY; GoPay app users transacted 2.4× more per person vs pre-app era.
- Delivery: Premium Food GTV +157% YoY, showing that upselling higher-value meals is working.
- Ads: Food ads share of GMV rose to ~1.8% in Q2’25, meaning merchants are spending more per customer.
The takeaway: Gojek’s revenue per user is rising not just from higher prices but from deeper cross-service engagement — a model entrepreneurs can replicate.
Cost Structure & Profit Margins (Gojek / GoTo)
Understanding how Gojek spends money is just as important as knowing how it earns. In 2025, GoTo’s turnaround into positive EBITDA was driven by tight cost control and smarter unit economics.
Major Cost Categories
- Technology Infrastructure
- Cloud hosting, app development, payment processing, and AI/ML for pricing/fraud detection.
- In 2025, GoTo completed cloud migration, expected to cut annual cloud expenses by 50%+. This was a major driver of profitability gains.
- Marketing / CAC (Customer Acquisition Cost)
- Historically one of the largest expenses (discounts, promos, cashbacks).
- Now more merchant-funded promotions replace GoTo-funded ones, reducing burn.
- GoClub loyalty reduces dependence on cash promos.
- Operations
- Driver incentives, logistics costs, call centers, and local operations staff.
- Streamlined by AI routing, batching deliveries, and algorithmic incentive adjustments.
- R&D Investments
- Focus on fintech, AI-driven personalization, and fraud prevention.
- Also investing in financial products (GoPayLater, GoPay Pinjam), which require underwriting and compliance systems.
Unit Economics Breakdown
- Mobility: Lower margins due to regulated fare caps and driver incentives.
- Delivery: Higher effective take rate due to commissions + ads, moving toward positive unit economics.
- Fintech: Highest margin segment (76% YoY revenue growth in Q2 2025), with credit/lending generating strong incremental profit.
Example:
- ODS (Mobility + Delivery) Adjusted EBITDA margin improved from 0.6% (Q2 2024) → 2.0% (Q2 2025).
- Fintech Adjusted EBITDA turned positive at IDR 88 bn in Q2 2025, proving scalability.
Path to Profitability
- Q2 2025: GoTo reported Adjusted EBITDA +IDR 427 bn and EBITDA +IDR 292 bn.
- Net loss narrowed ~80% YoY to (IDR 375 bn).
- Gross profit margin: ~54% (Q2 2025).
- Key drivers: reduced cloud costs, shifting promo burden to merchants, stronger fintech margins.
Margin Improvement Strategies
- Shift to high-margin fintech (GoPayLater, lending, merchant payments).
- Advertising monetization inside GoFood.
- Cost discipline: cloud savings, leaner operations.
- Merchant-funded growth instead of company-funded discounts.
- Cross-service bundling to increase ARPU without raising CAC.
Future Revenue Opportunities & Innovations (Gojek / GoTo)
Gojek’s 2025 financials show that it has achieved profitability inflection, but the bigger question is: where will the next wave of growth come from? Here’s what’s on the horizon.
New Revenue Streams Being Tested
- Advertising as a platform: GoTo is aggressively scaling in-app advertising within GoFood. With food ads already contributing ~1.8% of GMV in 2025, the next step is expanding this into Mobility and Fintech screens.
- SME Solutions: Gojek is bundling financial services (POS systems, merchant credit, insurance) into GoPay/merchant dashboards, charging SaaS-style subscription fees.
- Insurance & Wealth Products: Tapping Indonesia’s underpenetrated financial market, GoTo could introduce micro-insurance, savings, and investment products via GoPay.
AI/ML Monetization Potential
- Dynamic pricing 2.0: More personalized fare/delivery pricing using demand, history, and willingness-to-pay.
- Credit scoring & lending: AI models enhance GoPayLater loan underwriting, reducing defaults and enabling higher loan volumes at lower risk.
- AdTech personalization: Merchant ads shown at hyperlocal, user-specific levels, increasing click-through rates and spend.
Expansion Markets Analysis
- Indonesia-first focus: GoTo is doubling down on Indonesia, where smartphone penetration and digital payments adoption still have room to grow.
- Southeast Asia: While Gojek previously retreated from some overseas markets, GoPay and GoTo Financial could expand regionally through partnerships (e.g., with telcos, TikTok, ShopeePay).
- Rural & Tier-2 cities: A major growth driver is penetrating less-digitized Indonesian cities with affordable delivery and micro-credit.
Emerging Features to Monetize
- Subscription bundles: A unified “GoTo Plus” subscription combining rides, food, and Tokopedia perks.
- BNPL Expansion: GoPayLater adoption in e-commerce (Tokopedia + external platforms) will multiply loan revenue.
- Driver ecosystem services: Fuel, maintenance, and micro-loans offered to drivers, monetized via margins and partnerships.
Predictions for 2025–2027
- Fintech will become >40% of total net revenue by 2027, overtaking Delivery.
- Advertising could grow from 1.8% of GMV → 3–5% of GMV, adding hundreds of billions of rupiah in high-margin revenue.
- Consolidation in SEA is possible — Gojek/GoTo may partner or merge with Grab or Shopee to fight global competition.
Threats to the Revenue Model
- Regulatory caps on ride-hailing commissions and lending APRs could limit monetization flexibility.
- Competition from Grab, ShopeeFood, and TikTok Shop.
- Credit risk: Fast-growing loan books carry default risk if not managed.
- Ad fatigue: Overloading the app with merchant ads could harm UX.
Why This Creates Opportunities for New Players
- Gojek’s scale means it sometimes can’t move fast in niche verticals.
- Entrepreneurs can exploit gaps in specialized food delivery, hyperlocal lending, or B2B fintech tools for SMEs.
- Super-app fatigue also creates room for focused apps that do one thing better (e.g., instant grocery, niche ride segments, or lending-only platforms).
For Miracuves clients, the lesson is clear: clone the proven super-app model, but carve out unique features or niches where incumbents are slower to move.
Lessons for Entrepreneurs & Your Opportunity
Studying Gojek’s revenue model is more than financial analysis — it’s a roadmap for entrepreneurs who want to build scalable, profitable platforms. Here’s what stands out:
Key Takeaways from Gojek’s Model
- What works and why
- Multi-service stickiness: Once users adopt food + rides + payments, churn drops dramatically.
- Fintech integration: Payments and lending supercharge margins beyond low-margin logistics.
- Merchant-funded promos & ads: Shifts cost burden from platform to ecosystem, protecting profitability.
- What to replicate
- Super-app flywheel: Connect multiple daily-use cases into one ecosystem.
- Data-driven personalization: Use AI for pricing, credit scoring, and recommendations.
- Cross-selling fintech: Monetize beyond core services with payments, lending, and insurance.
- What to improve
- Focus on unit economics early: Don’t burn cash endlessly on promos.
- Lean infrastructure from day one: Cloud cost optimization saved GoTo billions — a lesson for startups.
- Balance user experience with ads: Avoid overwhelming the interface while scaling ad monetization.
Market Gaps to Exploit
- SME credit & POS solutions: Indonesia’s SME sector is still underserved — similar gaps exist in other emerging markets.
- Tier-2 city penetration: Smaller cities often lack high-quality food delivery or cashless payments.
- Hyperlocal services: Focused verticals (instant grocery, pharmacy delivery, niche mobility like bikes/e-scooters).
- Financial literacy tools: Super-apps monetize lending, but don’t always educate users — startups can fill that gap responsibly.
Read More: Gojek App Marketing Strategy | How to Win the Super App Game
Revenue Model Innovations Possible
- Modular subscriptions: A la carte bundles for rides, food, and payments instead of one-size-fits-all.
- AI-driven micro-lending: Instant loans underwritten by behavioral data and repayment patterns.
- Merchant loyalty integration: Tie merchant ad spend directly to cashback/rewards for users, making ads “feel” like savings.
Want to build a platform with Gojek’s proven revenue model?
Miracuves helps entrepreneurs launch revenue-generating platforms with built-in monetization features.
Our Gojek clone scripts come with flexible revenue models — commissions, ads, subscriptions, fintech integration — all customizable to your market.
In fact, some Miracuves clients see revenue within 30 days of launch.
Get a free consultation to map out your revenue strategy today.
Final Thought
Gojek’s 2025 journey shows the evolution from a ride-hailing startup to a profitable super-app ecosystem. By blending on-demand services, fintech, and advertising, it has turned everyday habits — ordering food, commuting, paying bills — into multiple revenue streams.
For entrepreneurs, the lesson is simple: don’t think in silos. The real value comes from connecting services into a flywheel where each transaction fuels the next. Profitability is no longer about chasing scale at all costs — it’s about mastering unit economics, monetizing adjacencies, and innovating in niches where giants can’t move fast enough.
With the right strategy (and the right tech partner like Miracuves), building your own revenue-generating platform like Gojek Clone isn’t just possible — it’s achievable faster than you think.
FAQs
1) How much does Gojek make per transaction?
≈15–20% from merchants, 10–20% from drivers, plus ads & fintech fees.
2) What’s Gojek’s most profitable stream?
Fintech (GoPay & GoPayLater), contributing 31% of revenue in 2025.
3) How does Gojek’s pricing compare to competitors?
Comparable to Grab/ShopeeFood, but with more merchant-funded promos.
4) What % does Gojek take from providers?
15–20% (merchants), 10–20% (drivers), MDR for GoPay merchants.
5) How has the model evolved?
From ride-hailing → food & delivery → fintech & ads (profitability in 2025).
6) Can small platforms use similar models?
Yes — commissions, subscriptions, fintech, and ads scale down to niches.
7) What’s the minimum scale for profitability?
Tens of millions of MAUs for a super-app, but niche apps can break even earlier.
8) How to implement similar models?
Tiered commissions, subscriptions, fintech add-ons, merchant ads.
9) What are alternatives?
Vertical-focused apps, marketplace-first + fintech, B2B SaaS + payments.
10) How quickly can platforms monetize?
With the right model and Miracuves’ expertise, you can achieve launch-ready status in just 3–9 days with guaranteed delivery.