


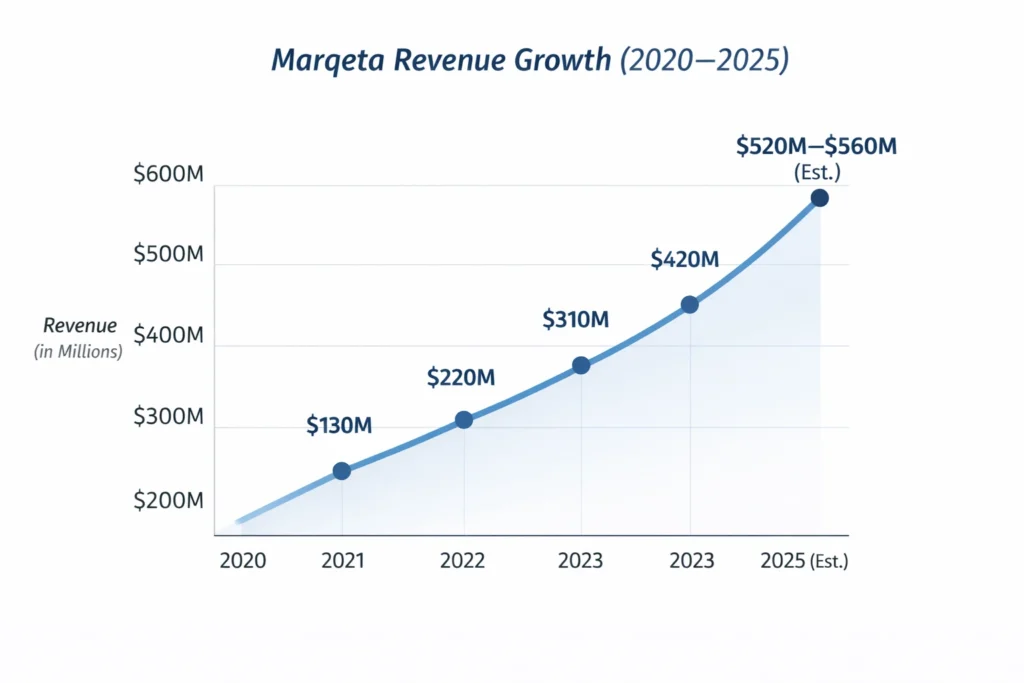
Marqeta crossed an estimated $520–560 million in annual revenue in 2025, positioning itself as one of the most influential card issuing and payment infrastructure platforms in the global fintech ecosystem. What began as a developer-friendly API for prepaid cards has evolved into a mission-critical financial backbone for some of the world’s largest digital banks, marketplaces, and payment apps.
For entrepreneurs, Marqeta’s success highlights how invisible infrastructure can generate massive recurring revenue. Most end users never see Marqeta’s brand, yet every transaction running through its platform contributes to predictable, high-volume cash flow. This business model demonstrates how fintech platforms can scale not through flashy features, but through deep integrations and long-term enterprise reliance.
Studying this model helps founders understand how payments, compliance, and embedded finance can be monetized at scale. In B2B fintech, trust, reliability, and regulatory readiness often matter more than marketing, making platforms like Marqeta a powerful case study in building defensible, high-retention revenue engines.
Marqeta Revenue Overview – The Big Picture
- 2025 Estimated Revenue: $520–560 million
- Valuation / Market Cap: ~$2.5–3 billion (public market range)
- YoY Growth (2024–2025): ~18–22%
- Revenue by Region:
- North America: 70%
- Europe: 20%
- Asia-Pacific & Others: 10%
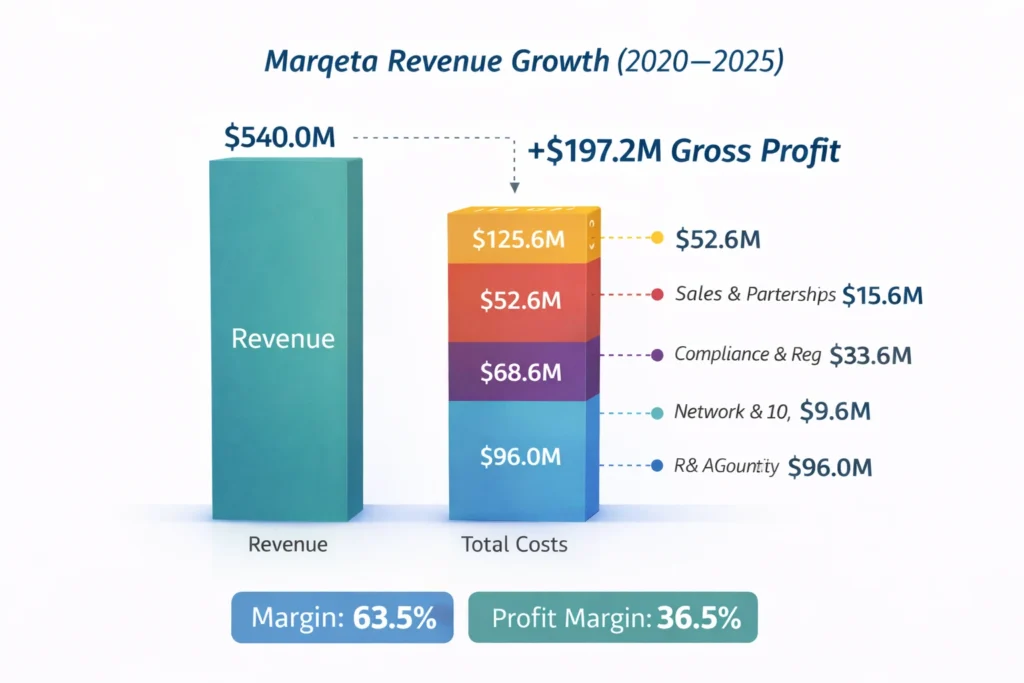
- Gross Margin: ~42–45%
- Net Margin: ~8–12%
- Key Competitors: Stripe Issuing, Adyen, Galileo, Paynetics, Solaris, Unit
Marqeta operates as a high-volume, transaction-driven fintech infrastructure company. Unlike SaaS platforms that scale through seats, Marqeta scales through payment flow, where every swipe, tap, or API call increases revenue.
Read More: Marqeta Explained: Modern Card Issuing & Payments Platform
Primary Revenue Streams Deep Dive
Revenue Stream #1: Interchange Revenue (Core Driver)
Marqeta earns a share of interchange fees every time a card transaction is processed.
- Share of Revenue: ~60%
- Pricing Logic: % of transaction value
- 2025 Contribution: ~$320 million
Revenue Stream #2: Platform & API Fees
Clients pay for access to Marqeta’s card issuing, tokenization, fraud tools, and compliance stack.
- Share of Revenue: ~20%
- Pricing: Monthly platform fees + usage tiers
- 2025 Contribution: ~$105 million
Revenue Stream #3: Program Management Services
Includes KYC, KYB, regulatory reporting, and operational support.
- Share of Revenue: ~10%
- Pricing: Per-account or per-card basis
- 2025 Contribution: ~$55 million
Revenue Stream #4: Value-Added Services
Advanced fraud protection, real-time spend controls, and data analytics.
- Share of Revenue: ~7%
- Pricing: Add-on modules
- 2025 Contribution: ~$38 million
Revenue Stream #5: International Expansion Fees
Cross-border transaction enablement and regional compliance support.
- Share of Revenue: ~3%
- 2025 Contribution: ~$15 million
Revenue Streams Percentage Breakdown
| Revenue Stream | % Share | 2025 Revenue Est. |
|---|---|---|
| Interchange Fees | 60% | $320M |
| Platform & API Fees | 20% | $105M |
| Program Management | 10% | $55M |
| Value-Added Services | 7% | $38M |
| International Fees | 3% | $15M |
The Fee Structure Explained
User-Side Fees (End Customers)
- Card transaction fees (embedded in merchant pricing)
- FX and cross-border markups
- ATM withdrawal fees (client-dependent)
Provider-Side Fees (Marqeta Clients)
- Monthly platform access fees
- Per-card issuance fees
- API call volume charges
Hidden Revenue Layers
- Revenue share agreements with banks and networks
- Premium fraud modules
- Enterprise compliance upgrades
Regional Pricing Variation
- Higher compliance fees in EU and UK
- Volume-based discounts in North America
- Expansion pricing for Asia-Pacific markets
Complete Fee Structure by User Type
| User Type | Fees Paid | Monetization Logic |
|---|---|---|
| Fintech Startup | Platform + API fees | Usage-based scaling |
| Digital Bank | Interchange share | High-volume revenue |
| Marketplace | Program management | Per-account monetization |
| Enterprise | Compliance modules | Long-term contracts |
How Marqeta Maximizes Revenue Per User
Marqeta segments clients by transaction volume and regulatory complexity. High-volume fintechs unlock premium pricing through advanced fraud prevention, tokenization, and real-time data APIs.
Upselling occurs when startups grow into multi-region operations, requiring additional compliance layers. Cross-selling includes analytics dashboards, network routing optimization, and spend controls.
Dynamic pricing adjusts based on transaction thresholds, while retention is driven by deep technical integration. Once a company builds its financial stack on Marqeta, switching costs become extremely high, pushing enterprise LTV beyond $500,000 per major client.
Cost Structure & Profit Margins
Major Cost Centers
- Network & Infrastructure Costs: ~28%
- Compliance & Regulatory Operations: ~20%
- Sales & Partnerships: ~15%
- R&D & Platform Security: ~17%
Unit Economics
- Average enterprise onboarding cost: ~$40,000
- Interchange gross margin: ~45%
Marqeta improves profitability by scaling transaction volume faster than fixed compliance and infrastructure costs, allowing margins to expand as global adoption increases.
Read More: Best Marqeta Clone Scripts 2026 – Launch a Card Issuing Platform
Future Revenue Opportunities & Innovations
New revenue streams include embedded credit, AI-driven fraud scoring, and real-time cross-border settlement tools. As fintech platforms expand globally, Marqeta can monetize regional licensing and regulatory infrastructure.
Between 2025–2027, growth is expected in crypto-linked cards, B2B expense management platforms, and neobank expansion across Asia and Latin America. Risks include regulatory shifts and pricing pressure from vertically integrated competitors.
Lessons for Entrepreneurs & Your Opportunity
What works is clear: own the infrastructure layer, not just the app layer. Marqeta proves that backend platforms can generate more durable revenue than consumer-facing fintech products.
Founders can replicate this by building niche financial infrastructure for industries like logistics, healthcare payouts, creator economies, or cross-border payroll.
Market gaps exist in regional compliance automation, AI-driven fraud prediction, and real-time treasury management for SMBs.
Want to build a platform with Marqeta’s proven revenue model? Miracuves helps entrepreneurs launch revenue-generating platforms with built-in monetization systems. Our Marqeta clone scripts come with flexible revenue models you can customize. In fact, some clients see revenue within 30 days of launch, and if you want it we may arrange and deliver it in 3–9 days.
If you want advanced language-level scripts or enhanced versions, Miracuves provides those too.
Final Thought
Marqeta shows that fintech success isn’t driven by brand visibility, but by becoming financial infrastructure that businesses depend on daily.
Its model highlights how transaction flow, compliance readiness, and enterprise trust combine into a powerful, scalable revenue engine.
For founders, the real opportunity lies in building specialized financial rails for underserved industries, where reliability and regulation create natural competitive moats.
FAQs
1. How much does Marqeta make per transaction?
Typically a small percentage of interchange, depending on volume and agreements.
2. What’s Marqeta’s most profitable revenue stream?
Interchange revenue from high-volume fintech and banking clients.
3. How does Marqeta’s pricing compare to competitors?
It is premium-priced but offers deeper compliance and customization.
4. What percentage does Marqeta take from providers?
Varies by contract, usually a share of interchange plus platform fees.
5. How has Marqeta’s revenue model evolved?
It shifted from prepaid cards to full-stack embedded finance.
6. Can small platforms use similar models?
Yes, by focusing on niche payment or payout infrastructure.
7. What’s the minimum scale for profitability?
Typically above $50 million in annual transaction volume.
8. How to implement similar revenue models?
Start with API-based services, then layer compliance and interchange.
9. What are alternatives to Marqeta’s model?
SaaS-only pricing, flat per-card fees, or white-label banking platforms.
10. How quickly can similar platforms monetize?
Initial monetization can begin within 60–90 days after first integrations.