


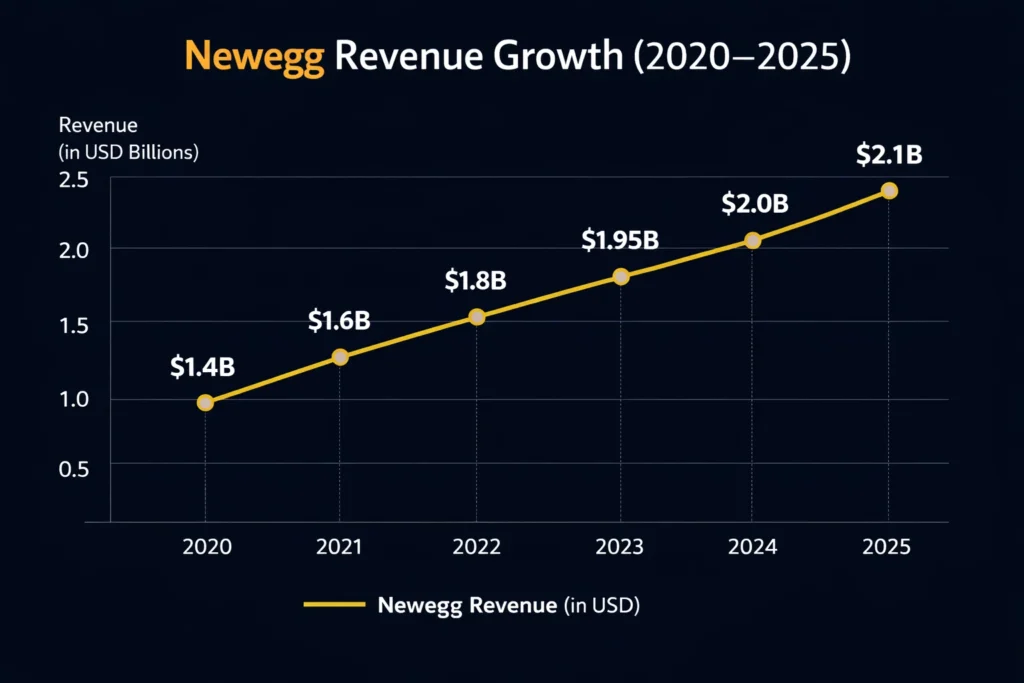
Newegg recorded approximately $2.1 billion in revenue in 2025, reaffirming its position as a specialized eCommerce leader in electronics. This scale is driven by a mix of first-party product sales, third-party marketplace commissions, and high-margin advertising—allowing Newegg to grow sustainably despite thin retail margins.
Unlike general marketplaces, Newegg monetizes deep-category expertise in PC hardware, gaming, and enterprise IT. Features like component compatibility tools, detailed specs, expert reviews, and configuration guidance increase buyer confidence, boost conversion rates, and enable premium monetization through ads, warranties, and services.
For founders, Newegg offers a strong blueprint for building vertical-first marketplaces with layered monetization. By combining product sales, seller fees, fulfillment services, and advertising within a trusted niche, founders can create defensible platforms that outperform broad marketplaces on margins, loyalty, and long-term value.
Newegg Revenue Overview – The Big Picture
- 2025 Revenue: ~$2.1 billion
- Valuation: ~$1.7 billion (market capitalization estimates)
- YoY Growth: ~6%
- Revenue by Region:
- North America: 72%
- Asia-Pacific: 18%
- Europe & Others: 10%
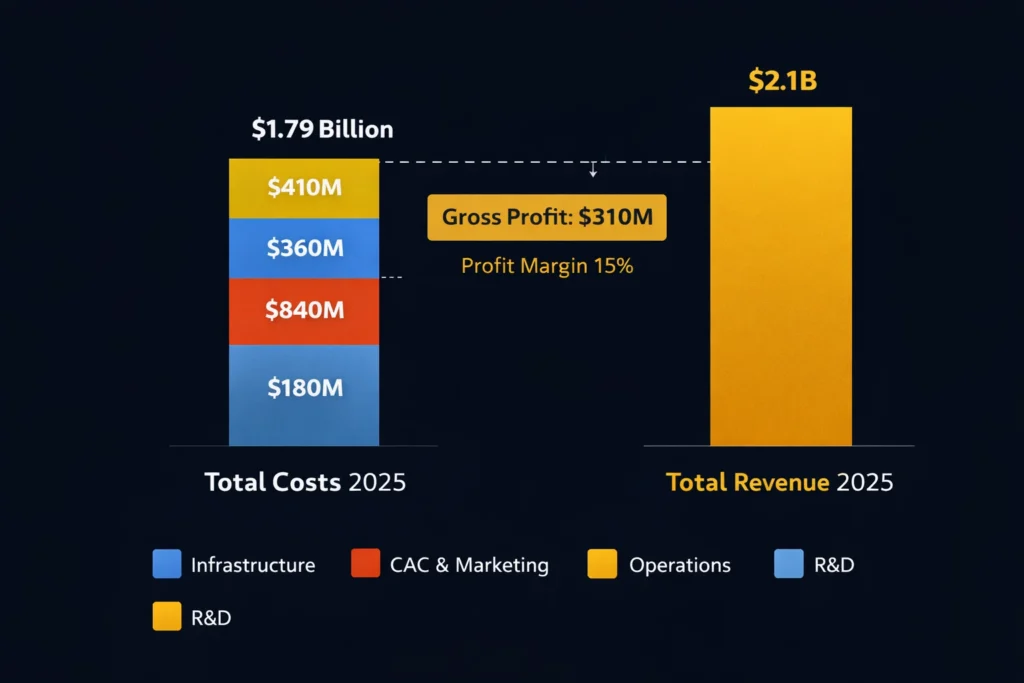
- Gross Profit Margins: 14–17%
- Competition Benchmark: Amazon Electronics, Micro Center, Best Buy Marketplace
Read More: What is Newegg and How Does It Work?
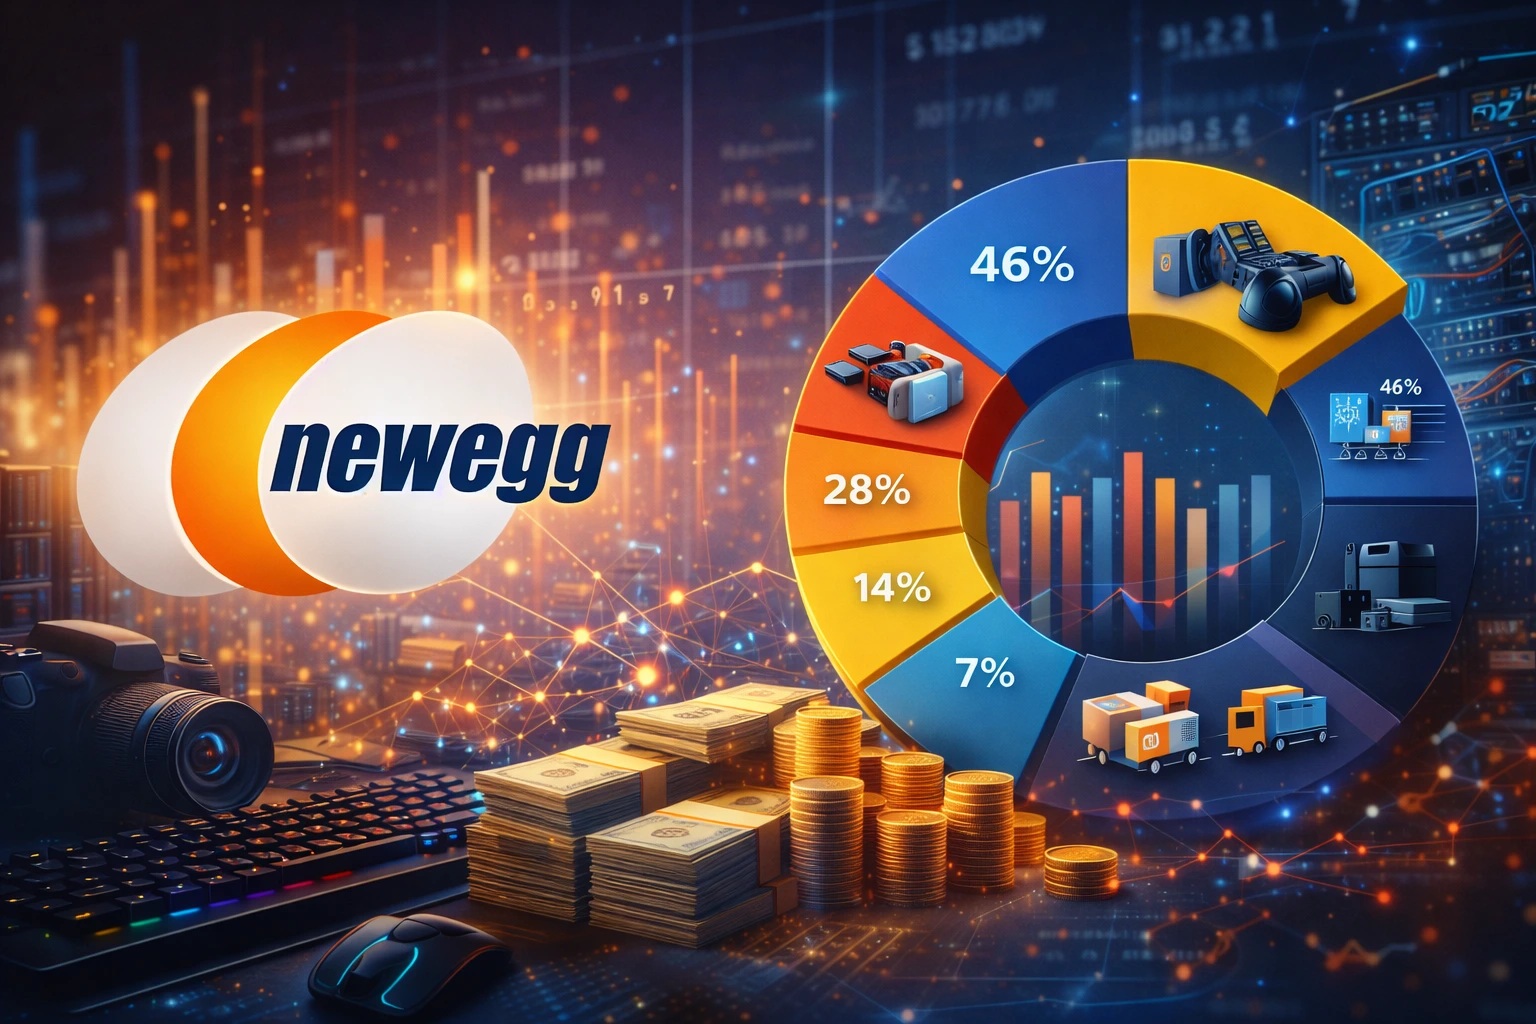
Primary Revenue Streams Deep Dive
Revenue Stream #1: Product Sales (First-Party Retail)
Newegg sells inventory directly, especially GPUs, CPUs, and gaming hardware.
- Revenue Share: ~46%
- Margin: Low (6–9%) but high volume
- 2025 Contribution: ~$970M
Revenue Stream #2: Marketplace Seller Commissions
Third-party sellers list products on Newegg’s platform.
- Commission: 8%–15% per sale
- Revenue Share: ~28%
- 2025 Contribution: ~$590M
Revenue Stream #3: Advertising & Sponsored Listings
Brands pay to rank higher in category and search pages.
- Revenue Share: ~14%
- 2025 Contribution: ~$295M
Revenue Stream #4: Fulfillment & Logistics Services
Includes warehousing, shipping, and returns for sellers.
- Revenue Share: ~7%
Revenue Stream #5: B2B & Enterprise Sales
Bulk IT procurement and corporate hardware contracts.
- Revenue Share: ~5%
Revenue streams percentage breakdown
| Revenue Stream | How it generates revenue | Typical pricing / fee model | Estimated % Share |
|---|---|---|---|
| 1) First-Party Product Sales | Newegg sells electronics inventory directly (PC parts, gaming, accessories) | Retail margin on products | 46% |
| 2) Marketplace Seller Commissions | Commission from third-party sellers on each sale | 8%–15% per transaction | 28% |
| 3) Advertising & Sponsored Listings | Paid product placement in search, category, and deal pages | CPC / CPM bidding | 14% |
| 4) Fulfillment & Logistics Services | Warehousing, shipping, returns for marketplace sellers | Per-unit / volume-based fees | 7% |
| 5) B2B & Enterprise Sales | Bulk IT hardware procurement and corporate contracts | Contract-based pricing | 5% |
| Total | 100% |
The Fee Structure Explained
User-Side Fees
- Shipping charges (varies by speed & region)
- Optional warranty extensions
Provider-Side Fees
- Seller commission (8%–15%)
- Fulfillment & storage fees
- Advertising bid costs
Hidden Revenue Layers
- Extended warranties
- Brand promotion bundles
- Priority seller placement
Regional Pricing Variation
- Higher logistics fees in APAC
- US pricing optimized for fast shipping margins
Complete fee structure by user type
| User Type | Fee Category | What it’s for | How it’s charged | Typical Range / Notes |
|---|---|---|---|---|
| Buyer | Product Price | Cost of electronics or components purchased | Fixed / dynamic pricing | Varies by category, brand, and demand |
| Buyer | Shipping Fee | Order delivery from warehouse or seller | Flat or tiered | Free on select items, higher for expedited shipping |
| Buyer | Sales Tax / VAT | Government-imposed tax | Percentage of order | Depends on buyer location |
| Buyer | Extended Warranty / Protection Plan | Device protection beyond standard warranty | Add-on fee | Optional, varies by product |
| Buyer | Financing / EMI Charges | Installment-based purchases | Interest / service fee | Partner-based financing fees |
| Seller (Marketplace) | Marketplace Commission | Core fee for selling on Newegg | % of item price | 8%–15% depending on category |
| Seller (Marketplace) | Payment Processing Fee | Handling seller payouts | % or flat fee | Varies by payment method & region |
| Seller (Marketplace) | Fulfillment & Storage Fees | Warehousing, packing, shipping | Per-unit / volume-based | Higher for bulky or slow-moving items |
| Seller (Marketplace) | Advertising / Sponsored Listings | Product visibility in search & categories | CPC / CPM bids | Optional, auction-based |
| Seller (Marketplace) | Returns & Refund Handling | Processing returned items | Per-return charge | Depends on return reason |
| Seller (Marketplace) | Account Maintenance / Compliance | Policy enforcement & seller tools | Conditional charges | Penalties for violations or poor metrics |
| Brand / Enterprise | Bulk Procurement Fees | Large-volume hardware sourcing | Contract-based | Enterprise pricing models |
| Brand / Enterprise | Promotional Campaigns | Homepage banners, deals, launches | Contract / campaign fee | Seasonal or launch-based |
| Brand / Enterprise | Data & Sales Insights | Category performance & demand analytics | Subscription / contract | Used by OEMs and distributors |
| Brand / Enterprise | Fulfillment Partnerships | Managed logistics & distribution | Service-based | Depends on SLA and scale |
How Newegg Maximizes Revenue Per User
- Segmentation: Gamers, DIY builders, enterprises
- Upselling: Extended warranties, faster shipping
- Cross-Selling: Accessories bundled with core hardware
- Dynamic Pricing: Real-time price changes based on supply
- Retention Monetization: Loyalty programs & targeted deals
- LTV Optimization: Repeat PC builders show 3.8x LTV
- Psychological Pricing: Limited-stock alerts drive urgency
Real-world data shows customers buying bundled components spend 34% more per order.
Cost Structure & Profit Margins
Infrastructure Cost
- Warehousing
- Marketplace platform & cloud hosting
Customer Acquisition & Marketing
- Performance ads
- Influencer & tech reviewer partnerships
Operations
- Inventory management
- Returns & customer support
R&D
- Recommendation engines
- Seller analytics tools
Unit Economics
- Average order value: ~$420
- Gross margin per order: ~$65
Profitability Path
Newegg remains thin-margin but improves profitability through ads and seller services.
Read More: Best Newegg Clone Script 2025 – Launch a Electronics Marketplace
Future Revenue Opportunities & Innovations
- AI-based component recommendation engines
- Subscription-based PC upgrade programs
- White-label marketplace tech for OEMs
- Expansion into refurbished electronics
- Deeper B2B SaaS procurement tools
Risks & Threats
- Amazon pricing pressure
- Hardware demand cyclicality
Opportunities for New Founders
Vertical marketplaces outperform general platforms when expertise is monetized.
Lessons for Entrepreneurs & Your Opportunity
What works is category specialization with trust.
What to replicate is marketplace + ads + services stacking.
Market gaps exist in refurbished electronics, regional PC marketplaces, and B2B hardware procurement.
Want to build a platform with Newegg’s proven revenue model? Miracuves helps entrepreneurs launch revenue-generating platforms with built-in monetization systems. Our Newegg clone scripts come with flexible revenue models you can customize. In fact, some clients see revenue within 30 days of launch, and if you want it we may arrange and deliver it in 30–90 days.
If you want advanced language-level scripts or enhanced versions, Miracuves provides those too.
Final Thought
Newegg proves focus beats scale by dominating a narrow but high-value category rather than competing across everything. Its deep specialization in PC hardware, gaming, and enterprise IT allows it to offer better discovery, comparison tools, and buyer confidence than general marketplaces.
Its real edge lies in monetizing expertise, not just traffic. Newegg converts technical knowledge into revenue through sponsored listings, configuration guides, compatibility checks, warranties, and B2B procurement services—capturing value beyond simple product clicks.
For founders, vertical eCommerce remains one of the most defensible models. Category authority, supplier relationships, and expert-led buying experiences create higher switching costs, better margins, and long-term customer loyalty that broad marketplaces struggle to replicate.
FAQs
1. How much does Newegg make per transaction?
Around $60–$70 depending on category and services used.
2. What’s Newegg’s most profitable revenue stream?
Advertising and sponsored product placements.
3. How does Newegg’s pricing compare to Amazon?
Often competitive in hardware but with higher service margins.
4. What percentage does Newegg take from sellers?
Typically 8%–15%.
5. How has Newegg’s revenue model evolved?
From retail-only to marketplace plus advertising.
6. Can small platforms use similar models?
Yes, especially niche electronics or vertical hardware markets.
7. What’s the minimum scale for profitability?
Roughly 10,000–15,000 monthly orders.
8. How to implement similar revenue models?
Start with commissions, then add ads and fulfillment.
9. What are alternatives to Newegg’s model?
Subscription commerce or direct-to-consumer hardware sales.
10. How quickly can similar platforms monetize?
Many businesses begin generating revenue soon after launch.