


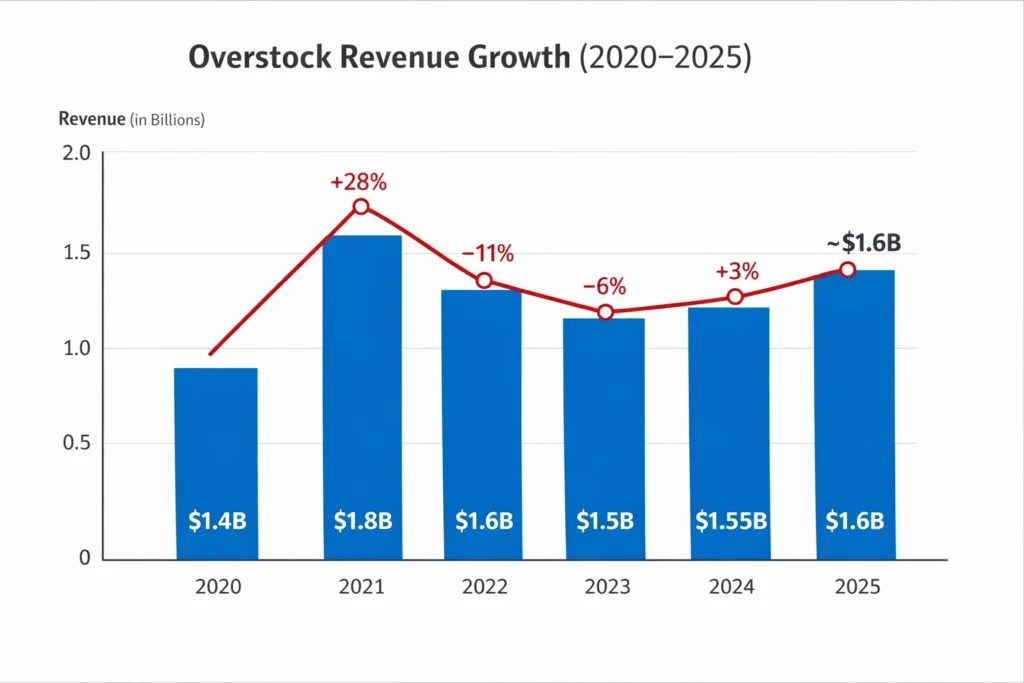
Overstock posted an estimated $1.6 billion in revenue in 2025, proving that large-scale home commerce platforms can still grow in a highly competitive market. This performance reflects strong brand recall, consistent demand in home essentials, and a shift toward more efficient digital-first operations that prioritize profitability over aggressive expansion.
Behind this figure is a carefully layered revenue model combining marketplace economics, owned inventory, and high-margin digital monetization. By reducing inventory risk through third-party sellers, leveraging private-label margins, and monetizing traffic via advertising and services, Overstock has created multiple revenue levers that stabilize cash flow even during market slowdowns.
For founders, Overstock is a practical blueprint for building a capital-efficient yet scalable eCommerce platform in furniture, lifestyle, and vertical marketplaces. Its model demonstrates how combining operational discipline, diversified monetization, and long-term customer value can help new platforms scale sustainably without relying solely on discount-driven growth.
Overstock Revenue Overview – The Big Picture
- 2025 Revenue: ~$1.6 billion
- Valuation: ~$1.1–1.3 billion (market-based estimate)
- YoY Growth: ~4%
- Revenue by Region:
- United States: ~88%
- International: ~12%
- Average Gross Margin: ~22–24%
- Primary Competitors: Wayfair, Amazon Home, IKEA online
Read More: What Is Overstock and How Does It Work?
Primary Revenue Streams Deep Dive
Revenue Stream #1: Marketplace Commissions
Overstock operates a hybrid marketplace where third-party sellers list furniture and home goods.
- Commission range: 8–15% per transaction
- Share of revenue: ~45%
- Low inventory risk, scalable margins
Revenue Stream #2: First-Party (Private Label) Sales
Overstock sells its own curated inventory under private labels.
- Higher control over pricing
- Revenue share: ~30%
- Margins outperform marketplace sales
Revenue Stream #3: Advertising & Sponsored Listings
Sellers pay for premium visibility.
- CPC & CPM-based pricing
- Revenue share: ~10%
- Extremely high-margin revenue
Revenue Stream #4: Logistics & Fulfillment Fees
White-glove delivery, large-item handling, and scheduled shipping.
- Charged per order or as bundled pricing
- Revenue share: ~8%
Revenue Stream #5: Financing & Protection Services
Extended warranties and buy-now-pay-later integrations.
- Revenue share: ~7%
Revenue Streams Percentage Breakdown
| Revenue Stream | % Share |
|---|---|
| Marketplace Commissions | 45% |
| First-Party Sales | 30% |
| Advertising & Sponsored Listings | 10% |
| Logistics & Fulfillment Services | 8% |
| Financing & Protection Services | 7% |
The Fee Structure Explained
- User-side fees:
- Optional delivery upgrades
- Assembly & protection plans
- Seller-side fees:
- Listing commission
- Advertising spend
- Fulfillment surcharges
- Hidden revenue layers:
- Payment processing margins
- Data-driven ad targeting
- Regional pricing variation:
- Higher logistics fees in rural regions
- Lower commissions for high-volume sellers
Complete Fee Structure by User Type
| User Type | Fee Type | Typical Rate |
|---|---|---|
| Buyer | Delivery & Assembly | $49–$199 |
| Buyer | Protection Plans | 3–7% of item |
| Seller | Marketplace Commission | 8–15% |
| Seller | Sponsored Ads | CPC-based |
| Seller | Fulfillment Services | Variable |
How Overstock Maximizes Revenue Per User
Overstock uses advanced segmentation to personalize home décor recommendations based on browsing behavior.
- Upselling: Premium materials, extended warranties
- Cross-selling: Bundled furniture sets
- Dynamic pricing: Seasonal demand-based price changes
- Retention monetization: Loyalty discounts drive repeat purchases
- LTV optimization: Repeat buyers spend ~2.4× more than first-time users
- Psychological pricing: Anchoring with higher MSRP
- Real data example: Sponsored listings convert ~3× better than organic listings
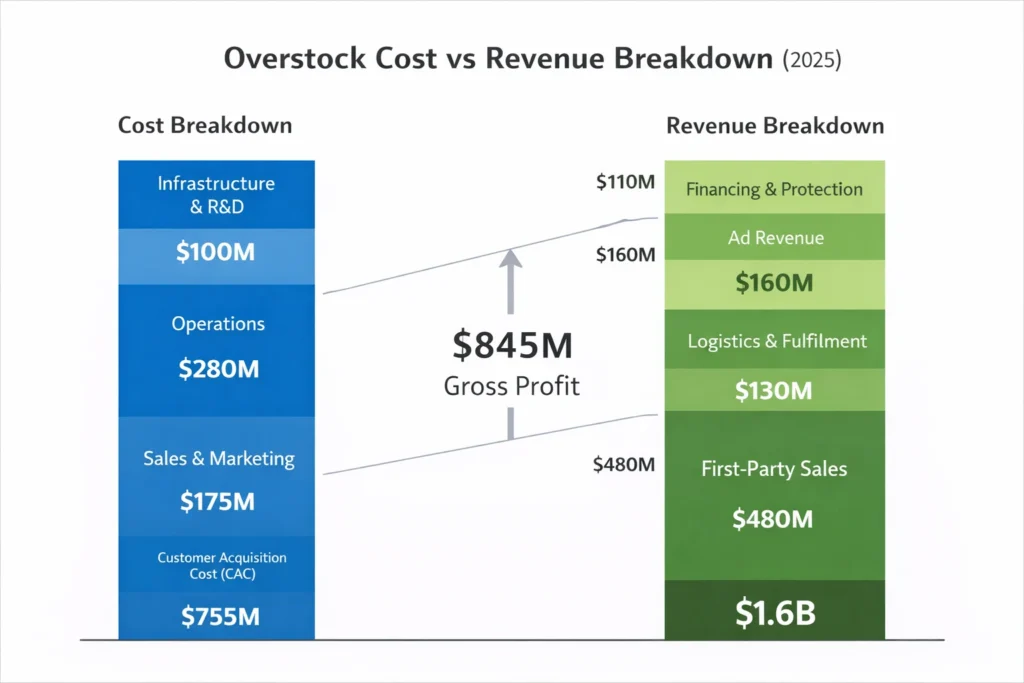
Cost Structure & Profit Margins
- Infrastructure: Cloud hosting, recommendation engines
- Customer Acquisition Cost: ~10–12% of revenue
- Operations: Warehousing, delivery coordination
- R&D: Personalization, logistics optimization
- Unit economics: Profitable after second purchase
- Margin optimization: Shift toward advertising & services
- Profitability path: Stable EBITDA through reduced inventory exposure
Read More: Best Overstock Clone Scripts 2025: a Deals-Driven Marketplace
Future Revenue Opportunities & Innovations
- AI-driven interior design recommendations
- AR-powered room visualization tools
- Subscription-based décor refresh services
- Expansion into B2B furniture procurement
- Predicted trends (2025–2027): Higher ad monetization share
- Risks: Logistics costs, price wars
- Opportunity: Vertical-focused furniture marketplaces
Lessons for Entrepreneurs & Your Opportunity
What works
- Hybrid marketplace + private label strategy
- Advertising layered over transactions
What to replicate
- Seller monetization before scaling inventory
- High-margin digital add-ons
Market gaps
- Regional furniture marketplaces
- Eco-friendly & modular furniture platforms
Founder improvements
- Faster delivery tech
- AI-led personalization from day one
Want to build a platform with Overstock’s proven revenue model? Miracuves helps entrepreneurs launch revenue-generating platforms with built-in monetization systems. Our Overstock-style clone scripts come with flexible revenue models you can customize. In fact, some clients see revenue within 30 days of launch, and if you want it we may arrange and deliver it in 30–90 days.
If you want advanced language-level scripts or enhanced versions, Miracuves provides those too.
Final Thought
Overstock proves that large-scale eCommerce profitability doesn’t rely solely on product margins. Instead, long-term success comes from building a business that can generate value at multiple touchpoints, even when product pricing becomes highly competitive or margins tighten.
The real advantage comes from layered monetization, seller tools, and data-driven upsells. By monetizing sellers, logistics, advertising, and customer behavior insights, Overstock maximizes revenue per transaction while keeping the core shopping experience simple and attractive for users.
For founders, this model offers a clear path to sustainable revenue. It shows how thoughtful platform design, diversified income streams, and intelligent use of data can create resilient eCommerce businesses that scale efficiently and remain profitable over time.
FAQs
1. How much does Overstock make per transaction?
Roughly 10–15% through commissions plus add-on services.
2. What’s Overstock’s most profitable revenue stream?
Advertising and sponsored listings.
3. How does Overstock’s pricing compare to competitors?
It competes closely with Wayfair but offers stronger private-label margins.
4. What percentage does Overstock take from sellers?
Between 8% and 15% depending on category.
5. How has Overstock’s revenue model evolved?
From inventory-heavy retail to a marketplace-led structure.
6. Can small platforms use similar models?
Yes, especially in niche or regional markets.
7. What’s the minimum scale for profitability?
Typically after consistent repeat buyers are acquired.
8. How to implement similar revenue models?
Start with commissions, then layer ads and services.
9. What are alternatives to Overstock’s model?
Subscription commerce or direct-to-consumer brands.
10. How quickly can similar platforms monetize?
Many begin generating revenue within weeks of launch.