


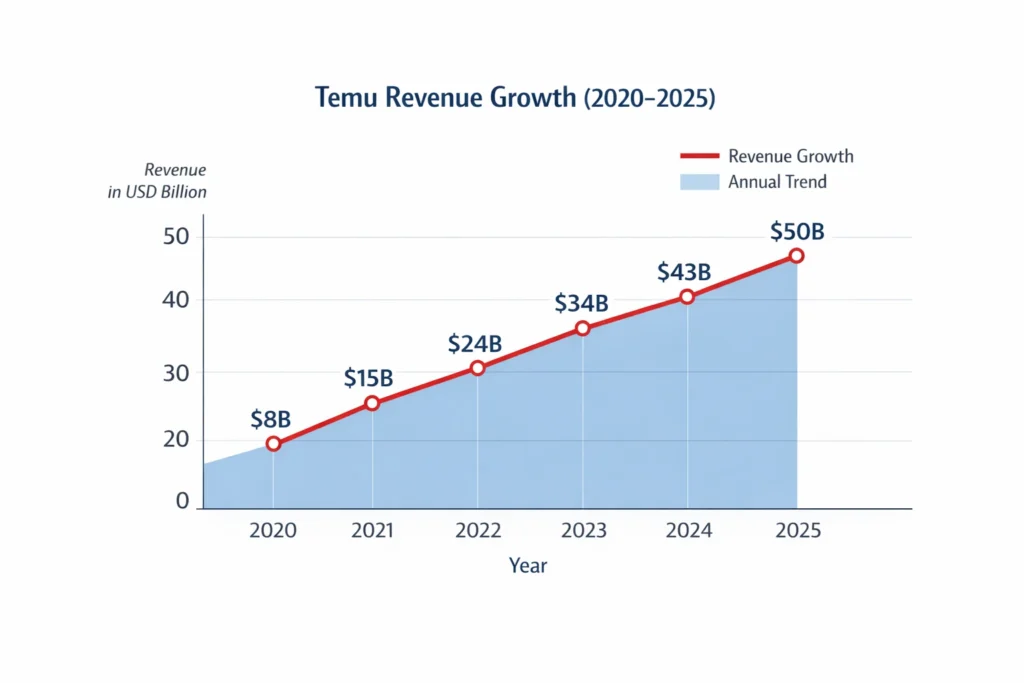
Temu crossed $50 billion in GMV in 2025, becoming one of the fastest-scaling global eCommerce platforms ever. This growth was driven by rapid international expansion, aggressive user acquisition, and a marketplace structure built for high-frequency, low-value transactions. By prioritizing volume and reach over early margins, Temu achieved scale at a pace few global platforms have matched.
What’s surprising is not just the growth, but how Temu sustains ultra-low prices while still building a profitable long-term model. The platform controls pricing through direct supplier relationships, consolidated logistics, and data-driven demand forecasting. These mechanisms reduce supply-chain inefficiencies and allow Temu to pass savings to consumers while protecting platform-level margins.
For founders, Temu offers a masterclass in scale economics, supplier leverage, and platform-first monetization. It demonstrates how owning supply-side dynamics and monetization levers—rather than relying solely on consumer pricing—can unlock sustainable profitability. This model provides a powerful blueprint for building large-scale marketplaces that compete on efficiency, not branding alone.
Temu Revenue Overview – The Big Picture
Temu operates as a cross-border marketplace connecting global consumers directly with manufacturers, primarily from Asia. Its model prioritizes volume, supply-side efficiency, and platform control.
- 2025 GMV: ~$50–52 billion
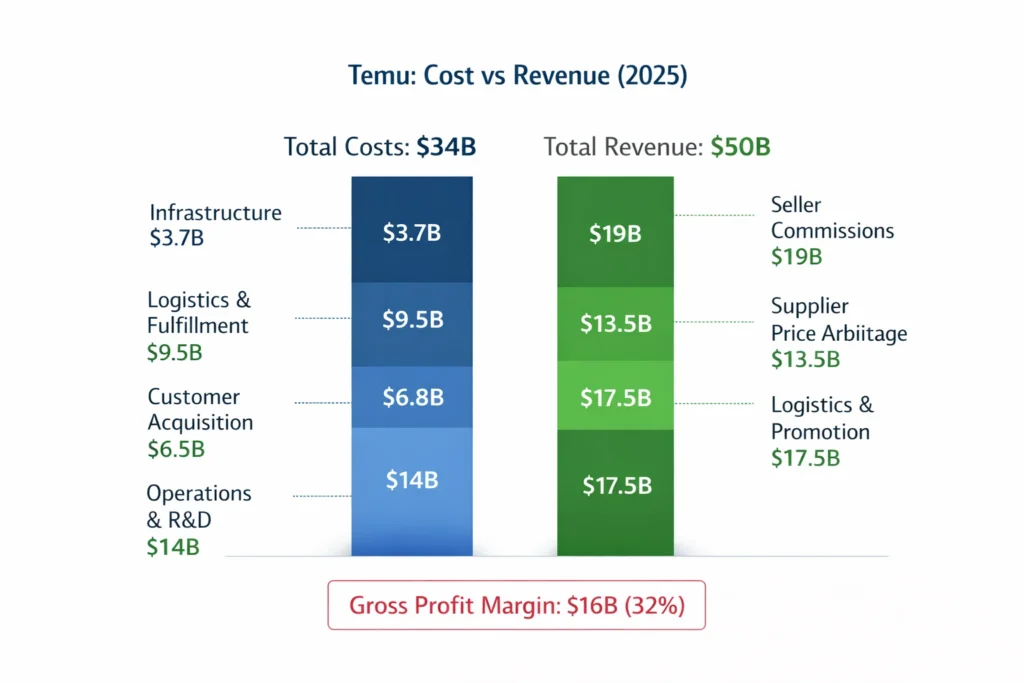
- 2025 Revenue (Net Platform Revenue): ~$18–20 billion
- Valuation (Parent – PDD Holdings): ~$190+ billion
- YoY GMV Growth: ~40%
- Primary Markets: US, Europe, LATAM
- Operating Margin (Platform-level): ~22–25%
- Profit Strategy: Long-term margin expansion through scale
Temu competes not on branding, but on price dominance and logistics optimization, forcing traditional marketplaces into margin pressure.
Read More: What Is Temu and How Does It Work?
Primary Revenue Streams Deep Dive
Revenue Stream #1: Seller Commissions
Temu earns a commission on every completed order. While rates are lower than traditional marketplaces, massive order volume compensates.
- Share of revenue: ~38%
- Average commission: 8–12%
- Focus: High frequency, low margin, high scale
Revenue Stream #2: Supplier Price Arbitrage
Unlike open marketplaces, Temu negotiates supplier pricing directly, earning margin between factory cost and consumer price.
- Share of revenue: ~27%
- High control over pricing and promotions
- Strong leverage due to bulk demand
Revenue Stream #3: Logistics & Fulfillment Margins
Temu manages cross-border logistics at scale, earning margin through consolidated shipping, routing optimization, and volume contracts.
- Share of revenue: ~15%
- Cost advantage improves with scale
Revenue Stream #4: Promotional Placement Fees
Suppliers pay for boosted visibility during flash sales, seasonal events, and demand surges.
- Share of revenue: ~12%
- Performance-based pricing model
Revenue Stream #5: Data & Demand Intelligence
Temu monetizes demand forecasting, pricing insights, and inventory signals for large suppliers.
- Share of revenue: ~8%
- Extremely high margin
Revenue Streams Percentage Breakdown
| Revenue Stream | % Share (2025) |
|---|---|
| Seller Commissions | 38% |
| Supplier Price Arbitrage | 27% |
| Logistics & Fulfillment Margins | 15% |
| Promotional Placement Fees | 12% |
| Data & Demand Intelligence | 8% |
The Fee Structure Explained
Temu’s fee system is intentionally buyer-friendly and supplier-heavy.
User-Side Fees
- No platform fees
- No subscriptions
- Free app usage
- Aggressive free-shipping thresholds
Supplier-Side Fees
- Transaction commission
- Logistics handling margin
- Promotional exposure fees
- Volume-based pricing adjustments
Hidden Revenue Layers
- Algorithmic exposure ranking
- Inventory priority access
- Demand surge pricing control
Regional Pricing Variation
Pricing dynamically adjusts based on logistics cost, import duties, and regional demand elasticity.
Complete Fee Structure by User Type
| User Type | Fee Type | Typical Range |
|---|---|---|
| Buyers | Platform usage | Free |
| Suppliers | Commission | 8–12% |
| Suppliers | Logistics margin | Variable |
| Suppliers | Promotional visibility | Performance-based |
How Temu Maximizes Revenue Per User
Temu focuses on basket expansion, not high ticket value.
- Segmentation: New users vs repeat bargain buyers
- Upselling: Bundled add-on products
- Cross-selling: “Frequently bought together” pricing
- Dynamic Pricing: Real-time factory cost adjustment
- Retention Monetization: Daily deals and gamified discounts
- LTV Optimization: Repeat purchase loops
- Psychological Pricing: Extreme anchoring and scarcity timers
In 2025, average user order frequency exceeded 9 orders per year, up from 6 in 2023.
Cost Structure & Profit Margins
Temu’s profitability improves with volume concentration.
- Infrastructure: Cloud, AI, platform systems (~11%)
- Logistics & Fulfillment: Shipping, customs (~28%)
- Customer Acquisition: Heavy but declining (~20%)
- Operations: Support, compliance (~6%)
- R&D: Pricing, demand prediction (~9%)
Unit Economics:
Low gross margin per order, but strong contribution margin at scale.
Profitability Path:
Loss-leading markets → volume dominance → margin expansion.
Read More: Best Temu Clone Scripts 2025 – Social Commerce Marketplace
Future Revenue Opportunities & Innovations
- AI-driven supplier bidding engines
- Private-label marketplace brands
- Regional micro-fulfillment hubs
- Faster delivery monetization tiers
Predicted Trends (2025–2027)
- Reduced customer acquisition costs
- Higher supplier take rates
- Regulatory pressure on cross-border pricing
For founders, vertical-focused or regional versions of this model remain largely untapped.
Lessons for Entrepreneurs & Your Opportunity
What Works
- Factory-direct sourcing
- Platform-controlled pricing
- Volume-first economics
What to Replicate
- Supplier aggregation
- Centralized logistics
- Data-driven pricing
Market Gaps
- Category-specific Temu-style platforms
- Regional manufacturing marketplaces
- B2B bulk cross-border platforms
Want to build a platform with Temu’s proven revenue model? Miracuves helps entrepreneurs launch revenue-generating platforms with built-in monetization systems. Our Temu clone scripts come with flexible revenue models you can customize. In fact, some clients see revenue within 30 days of launch, and if you want it we may arrange and deliver it in 30–90 days.
If you want advanced language-level scripts or enhanced versions, Miracuves provides those too.
Final Thought
Temu proves that extreme affordability and profitability are not opposites. By designing its marketplace around high-volume, low-margin transactions, the platform achieves profitability through sheer scale rather than premium pricing. This approach allows Temu to attract price-sensitive users globally while still building a strong revenue base.
By controlling supply, logistics, and pricing, the platform turns scale into leverage. Direct access to manufacturers, centralized logistics optimization, and data-driven pricing enable Temu to reduce inefficiencies that typically erode margins in cross-border commerce. As volume increases, these controls compound, further strengthening unit economics.
For founders, this model offers one of the most aggressive yet replicable marketplace blueprints today. It shows that owning the supply chain logic and pricing intelligence can unlock sustainable growth even in highly competitive markets. With the right infrastructure and data systems, similar models can be adapted for niche categories or regional marketplaces.
FAQs
1. How much does Temu make per transaction?
Low per order, but high aggregate due to massive volume.
2. What’s Temu’s most profitable revenue stream?
Supplier price arbitrage and promotional placements.
3. How does Temu’s pricing compare to competitors?
Significantly lower, driven by factory-direct sourcing.
4. What percentage does Temu take from suppliers?
Effective take rate ranges from 15–25% including logistics and promotions.
5. How has Temu’s revenue model evolved?
From subsidy-heavy growth to scale-driven efficiency.
6. Can small platforms use similar models?
Yes, especially in niche or regional markets.
7. What’s the minimum scale for profitability?
Typically 100k+ monthly active buyers.
8. How to implement similar revenue models?
Centralize supply, own logistics logic, optimize pricing with data.
9. What are alternatives to Temu’s model?
Subscription commerce or premium vertical marketplaces.
10. How quickly can similar platforms monetize?
Many begin monetizing within the first 30–90 days.