


Wish shocked global e-commerce by scaling to hundreds of millions of users through ultra-low pricing, aggressive mobile-first distribution, and cross-border commerce that directly connected global buyers with overseas manufacturers. Its ability to trigger impulse purchases at scale, combined with viral deal discovery and gamified shopping behavior, helped Wish grow rapidly across price-sensitive markets worldwide.
In 2025, Wish operates as a leaner, logistics-focused marketplace following major restructuring aimed at fixing unit economics rather than chasing raw GMV. The platform reduced low-quality sellers, improved delivery reliability, centralized logistics operations, and focused on fewer but higher-value transactions that generate stronger margins and repeat usage.
For founders, Wish serves as a powerful case study in commission-driven marketplaces combined with logistics monetization and behavioral pricing strategies. It shows how controlling fulfillment, optimizing repeat micro-purchases, and layering multiple revenue streams can convert thin margins into a sustainable and scalable marketplace business.
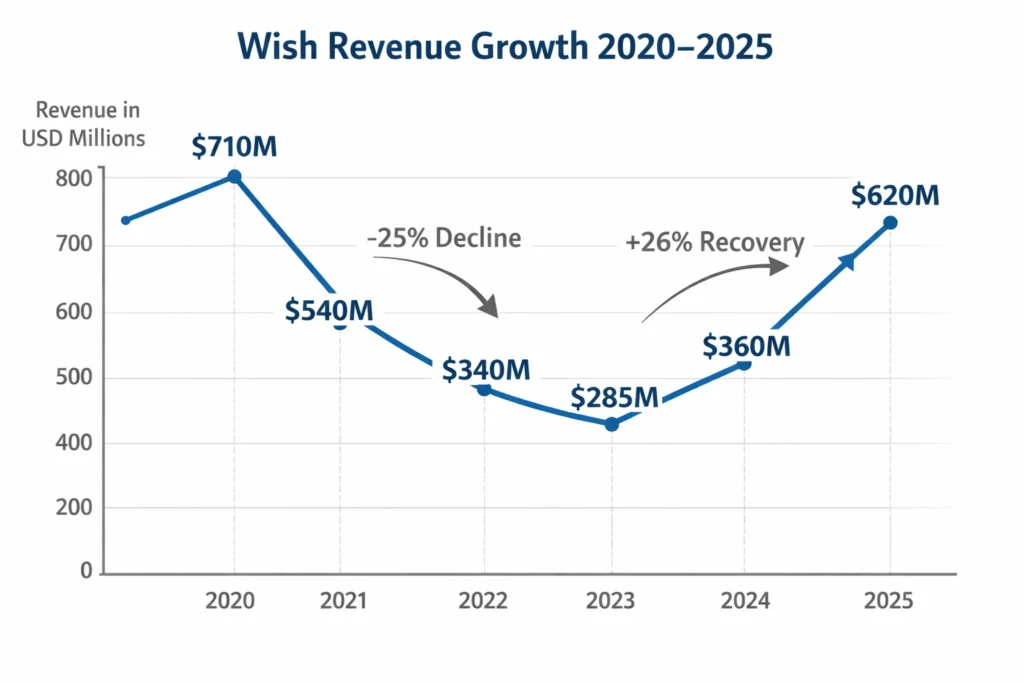
Wish Revenue Overview – The Big Picture
- 2025 Revenue: ~$620 million
- Valuation (private restructuring estimate): ~$2.5–3 billion
- YoY Growth (2024–2025): ~12% recovery growth
- Primary Markets: US, Europe, LATAM
- Average Gross Margin: 38–42%
- Competition Benchmark: Temu, AliExpress, Shein Marketplace
Wish’s pivot toward controlled logistics and higher-quality merchants stabilized revenues after years of decline.
Read More: What is Wish and How Does It Work?
Primary Revenue Streams Deep Dive
Revenue Stream #1: Marketplace Commission
Wish charges sellers a commission on every transaction completed on the platform.
- How it works: Percentage-based fee per order
- Commission range: 10%–20%
- Revenue share: ~45%
- 2025 contribution: ~$279M
Revenue Stream #2: Wish Logistics Program (WLP)
Wish earns margins by handling fulfillment, shipping, and customs.
- Seller pays: Per-order logistics fee
- Revenue share: ~30%
- 2025 contribution: ~$186M
Revenue Stream #3: On-Platform Advertising
Merchants pay to boost product visibility inside Wish.
- Pricing model: CPC & sponsored placements
- Revenue share: ~15%
- 2025 contribution: ~$93M
Revenue Stream #4: Merchant Services & Tools
Premium analytics, faster payouts, and promotional tools.
- Revenue share: ~7%
- 2025 contribution: ~$43M
Revenue Stream #5: Payment & FX Margins
Cross-border currency conversion and payment handling.
- Revenue share: ~3%
- 2025 contribution: ~$19M
Revenue Streams Breakdown Table
| Revenue Stream | % Share | 2025 Revenue (USD) |
|---|---|---|
| Marketplace Commissions | 45% | $279M |
| Logistics Program | 30% | $186M |
| Advertising | 15% | $93M |
| Merchant Services | 7% | $43M |
| Payments & FX | 3% | $19M |
The Fee Structure Explained
Wish monetizes both sides of the marketplace, maximizing take rate without upfront user fees.
User-Side Fees
- No signup fees
- Shipping fees (dynamic by region)
- Optional protection & fast delivery charges
Provider-Side Fees
- Sales commission
- Logistics handling fees
- Ad spend budgets
Hidden Revenue Layers
- Bulk shipping arbitrage
- Payment processing spread
- Data-driven ad pricing
Regional Pricing Variation
- Higher logistics margins in North America
- Lower commissions in emerging markets
Fee Structure Table
| User Type | Fee Type | Typical Range |
|---|---|---|
| Buyer | Shipping & handling | $2–$12 |
| Seller | Sales commission | 10%–20% |
| Seller | Logistics fee | $1.5–$6 per order |
| Seller | Advertising | CPC-based |
| Seller | Premium tools | Subscription-based |
How Wish Maximizes Revenue Per User
Wish focuses heavily on behavioral monetization.
- Segmentation: Price-sensitive buyers vs impulse buyers
- Upselling: Faster shipping, bundle deals
- Cross-selling: Related low-cost add-ons
- Dynamic pricing: Algorithm-driven discounts
- Retention monetization: Push notifications & deal drops
- LTV optimization: Repeat micro-purchases
- Psychological pricing: $1–$5 product anchoring
Real data shows users make 5–7 micro-purchases per year, driving strong cumulative revenue.
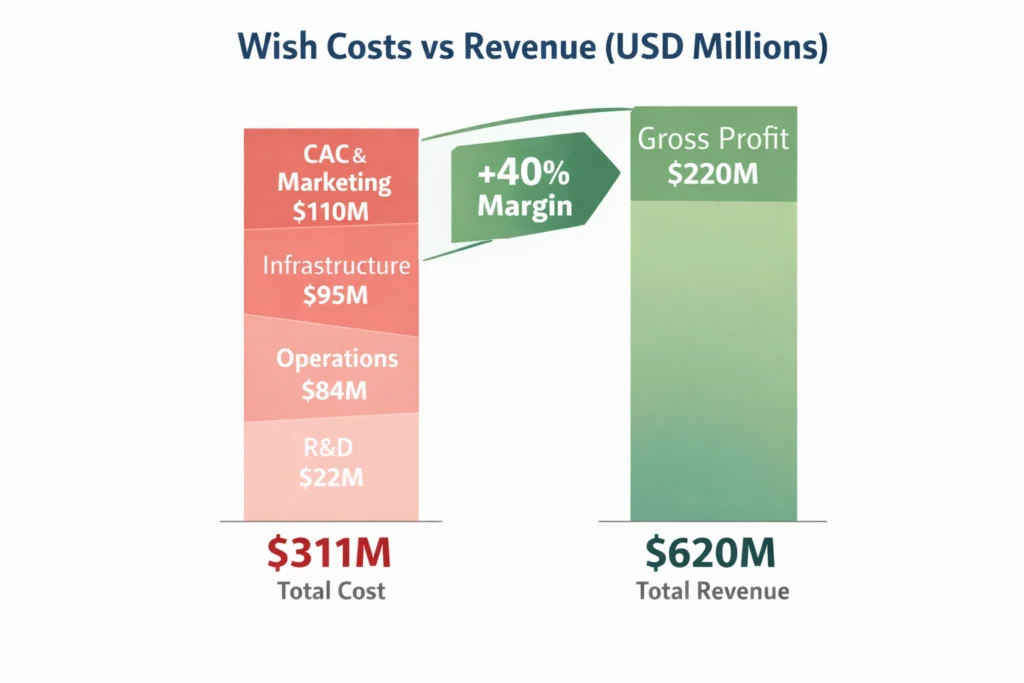
Cost Structure & Profit Margins
Major Cost Centers
- Infrastructure: Cloud, data, payments
- CAC & Marketing: Paid ads, app installs
- Operations: Logistics partnerships, customer support
- R&D: Marketplace algorithms, fraud detection
Unit Economics
- Avg order value: $14
- Avg gross profit per order: $5–6
- Contribution margin: ~40%
Wish reached operational profitability in select regions by optimizing logistics density.
Read More: Best Wish Clone Scripts 2025 | High-Growth Social Commerce App
Future Revenue Opportunities & Innovations
New Monetization Streams
- Seller financing & working capital
- AI-driven ad bidding
- Subscription-based fast shipping
AI/ML-Based Monetization
- Demand forecasting
- Fraud reduction
- Personalized pricing
Market Expansion
- LATAM cross-border hubs
- Eastern Europe logistics
Predicted Trends (2025–2027)
- Logistics-first marketplaces
- Fewer sellers, higher quality
- Margin over GMV focus
Risks & Threats
- Temu’s subsidized pricing
- Regulatory shipping costs
Opportunities for New Founders
- Niche logistics marketplaces
- Region-specific Wish-style platforms
Lessons for Entrepreneurs & Your Opportunity
What Works
- Commission + logistics stacking
- Low entry barriers for sellers
What to Replicate
- Micro-transaction psychology
- Algorithmic merchandising
Market Gaps
- Quality-focused discount platforms
- Faster local fulfillment
Founder Improvements
- Better seller vetting
- Transparent delivery timelines
Want to build a platform with Wish’s proven revenue model? Miracuves helps entrepreneurs launch revenue-generating platforms with built-in monetization systems. Our Wish clone scripts come with flexible revenue models you can customize. In fact, some clients see revenue within 30 days of launch, and if you want it we may arrange and deliver it in 30–90 days.
If you want advanced language-level scripts or enhanced versions, Miracuves provides those too.
Final Thought
Wish proves that pricing psychology combined with logistics control can build massive scale by driving impulse buying, repeat purchases, and global reach with minimal customer acquisition friction. By anchoring prices low and optimizing fulfillment, the platform was able to generate high transaction volumes while steadily improving margins through operational efficiency.
Its journey also highlights the dangers of pursuing growth without solid unit economics, where rapid expansion, unchecked seller quality, and rising fulfillment costs can quickly erode profitability. Wish’s restructuring shows that scale alone is not enough unless revenue per order, delivery predictability, and customer trust are carefully managed.
For founders, the opportunity lies in building leaner, smarter marketplaces with monetization baked in from day one, focusing on sustainable margins rather than vanity metrics. Platforms that balance pricing psychology, controlled logistics, and layered revenue streams can scale faster, recover quicker, and remain resilient in competitive markets.
FAQs
1. How much does Wish make per transaction?
Around $5–6 in gross profit per order.
2. What’s Wish’s most profitable revenue stream?
Logistics services combined with commissions.
3. How does Wish’s pricing compare to competitors?
Lower product prices, but higher reliance on logistics margins.
4. What percentage does Wish take from providers?
Between 10% and 20% per sale.
5. How has Wish’s revenue model evolved?
Shifted from pure GMV growth to margin-focused logistics.
6. Can small platforms use similar models?
Yes, especially in niche or regional markets.
7. What’s the minimum scale for profitability?
Roughly 500K–1M monthly active buyers.
8. How to implement similar revenue models?
Combine commissions, logistics control, and ads.
9. What are alternatives to Wish’s model?
Subscription marketplaces or B2B wholesale platforms.
10. How quickly can similar platforms monetize?
Many businesses begin generating revenue soon after launch.