Key Takeaways
What You’ll Learn
- GrabMart works as a hyperlocal grocery delivery platform connecting local stores, dark stores, and delivery partners in one fast-commerce ecosystem.
- Merchant commissions form the largest revenue layer, making store-side monetization central to the business model.
- Delivery fees, platform fees, and small-basket charges add important customer-side revenue on every order.
- Subscriptions, sponsored listings, and brand partnerships help increase retention while expanding revenue beyond basic order commissions.
- The model depends on frequency, logistics efficiency, and order density to scale profitably across urban grocery markets.
Stats That Matter
- The article estimates 2025 GMV at around $1.4–1.6 billion for GrabMart alone.
- Estimated net revenue contribution is roughly $380–450 million, with year-over-year growth of about 25–30%.
- Merchant commissions contribute about 45% of revenue, while delivery and service fees contribute about 25%.
- Subscriptions account for about 10%, while sponsored listings and ads contribute about 12% of total revenue.
- Average order value is estimated at $18–25, and the article places mature-city profit margins around 8–12%.
Real Insights
- Commission + fee hybrid monetization makes the model more resilient than depending on only one revenue source.
- Subscription-led retention helps increase repeat orders and improves customer lifetime value.
- Merchant advertising and sponsored placements create high-margin upside inside the grocery app itself.
- Hyperlocal logistics and data-driven pricing are critical because grocery delivery success depends on speed, density, and smart fulfillment economics.
- Long-term growth depends on high order frequency, strong merchant supply, and efficient last-mile delivery operations.
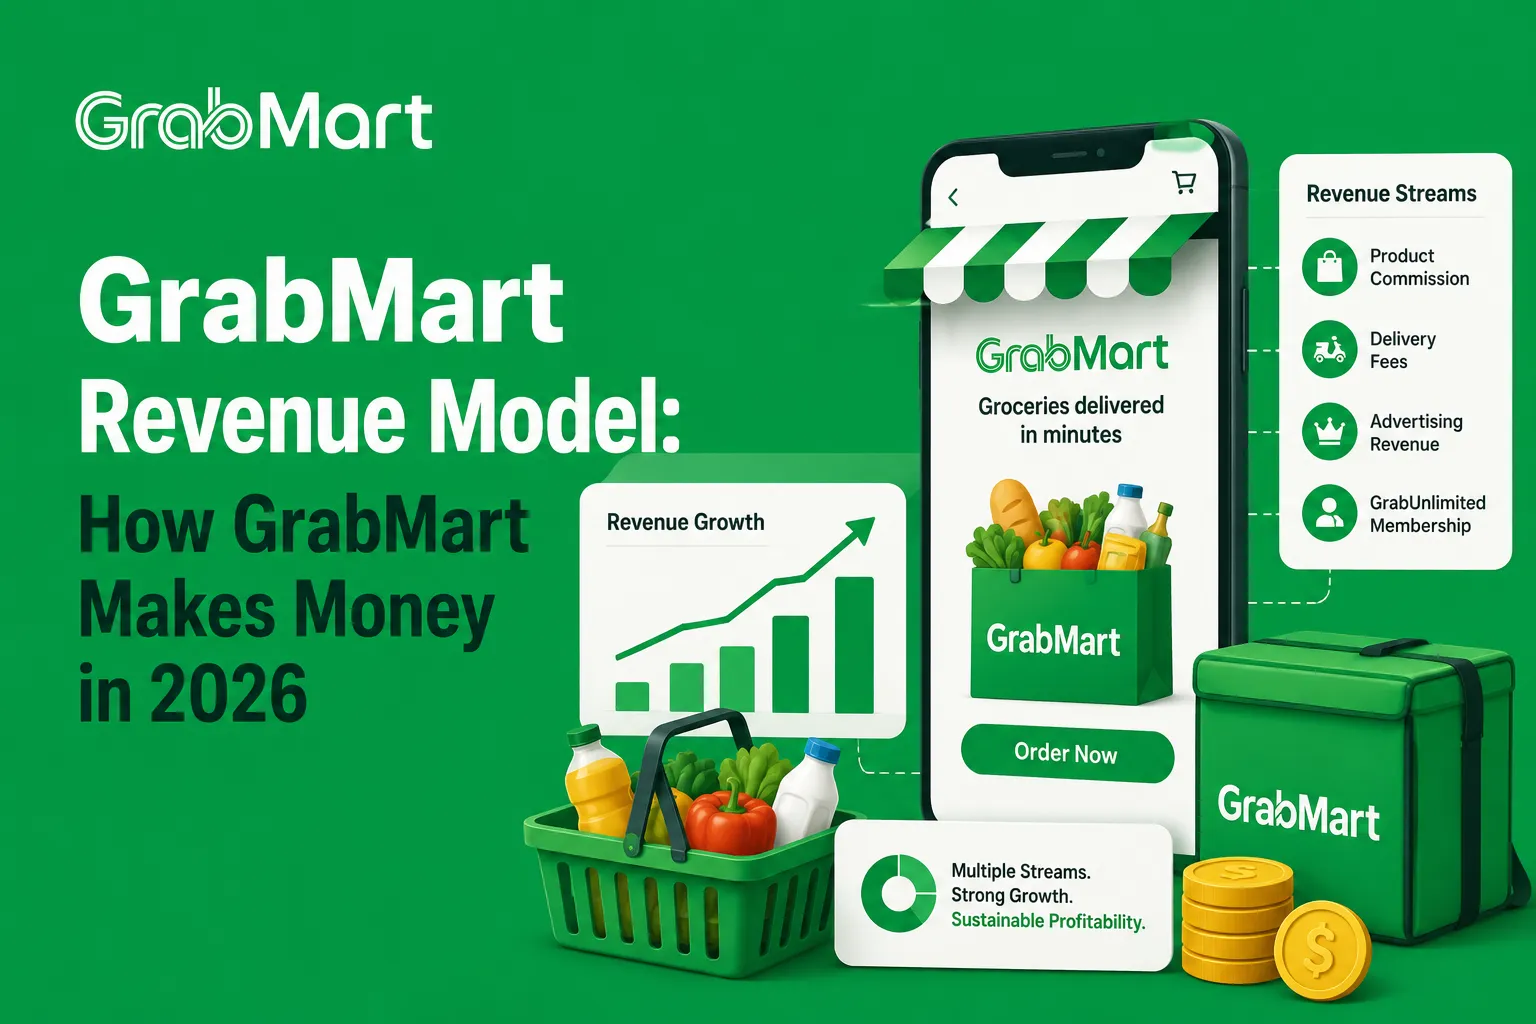
GrabMart is Grab’s on-demand grocery delivery platform across Southeast Asia, connecting local stores, dark warehouses, and delivery partners through a single ecosystem focused on speed and convenience.
By 2026, grocery has become one of Grab’s fastest-growing verticals as consumers shift from occasional food orders to frequent purchases of daily essentials, driving higher order frequency and repeat usage.
For founders building hyperlocal or instant-commerce platforms, GrabMart’s revenue model offers practical insights into monetizing frequency, optimizing logistics, and scaling profitably across dense urban markets.
GrabMart Revenue Overview – The Big Picture
GrabMart operates under Grab Holdings Ltd, whose Deliveries segment (food + grocery) is the company’s largest revenue contributor.
2026 Key Metrics (Estimated):
- 2026 GMV (GrabMart only): ~$1.4–1.6 billion
- 2026 Net Revenue Contribution: ~$380–450 million
- Grab Holdings Valuation: ~$18–20 billion
- YoY Growth (GrabMart): ~25–30%
- Primary Markets: Singapore, Indonesia, Malaysia, Vietnam, Thailand, Philippines
- Average Order Value: $18–25
- Profit Margin (mature cities): 8–12%
- Main Competitors: GoMart, ShopeeMart, Lazada, Amazon Fresh (select markets)
Read More: What is GrabMart and How Does It Work?

Primary Revenue Streams Deep Dive
Revenue Stream #1: Merchant Commission Fees
GrabMart earns a commission from grocery stores, supermarkets, and dark stores.
- Commission Range: 10–25% per order
- Revenue Share: ~45%
- Pricing Logic: Higher commission for high-demand or fast-delivery merchants
Revenue Stream #2: Delivery & Service Fees
Paid by customers per order.
- Delivery Fee: $1–4 (dynamic)
- Platform Fee: $0.50–1.50
- Revenue Share: ~25%
Revenue Stream #3: GrabUnlimited Subscriptions
Subscription model driving retention and frequency.
- Monthly Price: ~$3–5
- Benefits: Free deliveries, discounts
- Revenue Share: ~10%
Revenue Stream #4: Sponsored Listings & Ads
Merchants pay to boost visibility inside the app.
- CPC / CPA based ads
- Revenue Share: ~12%
- High-margin revenue
Revenue Stream #5: Data & Partner Promotions
Brand promotions, FMCG partnerships, analytics insights.
- Revenue Share: ~8%
Revenue streams percentage breakdown
| Revenue Stream | Description | % of Total Revenue (2026) |
|---|---|---|
| Merchant Commission Fees | Percentage charged to grocery stores & dark stores | 45% |
| Delivery & Service Fees | Customer-paid delivery, platform, and small-order fees | 25% |
| Subscriptions (GrabUnlimited) | Monthly plans offering free deliveries & discounts | 10% |
| Sponsored Listings & In-App Ads | Paid merchant promotions and featured placements | 12% |
| Data Partnerships & Brand Deals | FMCG promotions, analytics, co-marketing campaigns | 8% |
| Total | 100% |
The Fee Structure Explained
User-Side Fees
- Delivery fee
- Small basket fee
- Surge pricing during peak hours
- Subscription upsell
Provider-Side Fees
- Commission on orders
- Sponsored placement fees
- Promotional campaign fees
Hidden Revenue Layers
- Supplier-funded discounts
- Margin on private-label products
Regional Pricing Variation
Urban markets see higher AOV and lower delivery fees; tier-2 cities rely more on commissions.
Complete fee structure by user type
| User Type | Fee Category | What It Covers | Typical Pricing (2026) | When It Applies |
|---|---|---|---|---|
| Customer (Buyer) | Delivery Fee | Last-mile delivery cost (distance/time based) | $1.00–$4.00 per order | Every order; varies by distance, demand, weather |
| Customer (Buyer) | Platform / Service Fee | App convenience + operations support | $0.50–$1.50 per order | Most orders (can vary by market/promotions) |
| Customer (Buyer) | Small Basket Fee | Extra charge for low AOV orders to protect margins | $0.50–$2.00 | If cart value is below a threshold (e.g., <$10–$15) |
| Customer (Buyer) | Surge / Peak Pricing | Dynamic uplift to manage demand & rider supply | +10%–40% on delivery fee | Peak hours, heavy rain, holidays, shortages |
| Customer (Buyer) | Priority / Express Add-On | Faster delivery slot / instant dispatch | $0.50–$2.50 | Optional upgrade (availability varies) |
| Customer (Buyer) | Tip (Optional) | Customer-paid gratuity to delivery partner | 100% optional | Optional; passed to rider/driver (platform may not take a cut) |
| Customer (Buyer) | Subscription (GrabUnlimited) | Free/discounted deliveries + exclusive deals | $3–$5/month | Optional; reduces per-order fees for frequent users |
| Customer (Buyer) | Cancellation / No-Show Fee | Compensation for wasted rider time/merchant prep | $1–$5 | If late cancellation after dispatch or no-show cases |
How GrabMart Maximizes Revenue Per User
GrabMart focuses heavily on frequency-based monetization.
- Smart customer segmentation
- Subscription-driven upselling
- Cross-selling food + grocery orders
- AI-based dynamic pricing
- Reorder reminders & cart nudges
- Retention rewards via GrabRewards
- Optimized LTV through weekly usage
Example:
A subscribed household ordering twice weekly generates 3× more lifetime revenue than a casual user.
Cost Structure & Profit Margins
Major Costs
- Delivery partner incentives
- Cloud infrastructure & mapping APIs
- Customer acquisition (discounts, vouchers)
- Operations & merchant onboarding
- Product & AI development
Unit Economics
- Contribution margin positive in core cities
- Break-even achieved after ~15–18 orders per user
Profitability Path
- Higher subscription penetration
- Reduced incentives
- Private-label expansion
Future Revenue Opportunities & Innovations
New Revenue Streams
- Private-label groceries
- B2B bulk grocery delivery
- Dark store franchising
AI/ML Monetization
- Predictive demand pricing
- Smart inventory partnerships
Market Expansion
- Tier-2 cities
- Rural fulfillment hubs
Risks & Threats
- Thin margins
- High logistics costs
- Regulatory pressure
Founder Opportunities
Lessons for Entrepreneurs & Your Opportunity
What Works:
- Commission + fee hybrid model
- Subscription-led retention
- Merchant advertising monetization
What to Replicate:
- Hyperlocal logistics
- Data-driven pricing
- Frequency-first design
Market Gaps:
- Regional grocery brands
- Faster rural fulfillment
- B2B grocery supply
Founder Improvements:
- Lower-cost delivery models
- Community-driven sourcing
Miracuves GrabMart-Like Grocery Delivery Platform Solution Cost and Tech Stack
Miracuves Pricing for a GrabMart-Like Grocery Delivery Platform developed using Node.js / React.js Architecture is available on request. Contact Miracuves for custom pricing based on platform features, scalability requirements, integrations, and deployment scope. Estimated delivery timeline: 30 to 90 Days.
Build a powerful grocery delivery and quick commerce platform designed for startups, supermarkets, grocery chains, delivery businesses, and enterprise retail operations.
Core Workflows: Grocery product listings, online ordering systems, inventory management, delivery tracking, customer shopping workflows, payment processing, and quick commerce operations.
Built-in Commerce Operations: Real-time inventory synchronization, delivery partner management, dynamic pricing systems, order tracking, transaction monitoring, customer notifications, loyalty systems, and retail analytics reporting.
Management Hub: Admin dashboards, store management systems, delivery partner controls, inventory analytics, reporting dashboards, customer support workflows, audit logs, and centralized grocery operations management.
Enterprise-Ready: Fully customizable architecture prepared for secure scaling, multi-store operations, high-volume order management, cloud infrastructure expansion, enterprise retail ecosystems, and long-term platform growth.
Why does a GrabMart-Like Platform require Node.js / React.js architecture?
Grocery delivery platforms process real-time orders, inventory updates, delivery operations, payment workflows, and concurrent customer-delivery interactions. These platforms require scalable infrastructure, low-latency processing, and highly responsive interfaces across web and mobile ecosystems.
We recommend a modern JavaScript-based architecture for this type of platform because:
Built for Real-Time Operations: Node.js enables scalable backend operations for live order processing, inventory synchronization, delivery tracking, payment workflows, and concurrent retail activities.
Advanced Dashboard Experience: React.js supports highly interactive interfaces for grocery browsing, order tracking, delivery management, analytics reporting, and seamless customer shopping experiences.
Enterprise Scalability: This architecture is well-suited for handling high order volumes, multi-store retail ecosystems, delivery fleet operations, and rapidly growing quick commerce platforms.
Flexible Integration Layer: Easily integrates with payment gateways, POS systems, GPS tracking tools, CRM platforms, analytics systems, inventory management software, and third-party delivery services.
You get a scalable, enterprise-grade grocery delivery platform designed for long-term operational growth.
Note: Final pricing depends on platform modules, delivery workflows, third-party integrations, deployment infrastructure, payment systems, and custom workflow development.
Conclusion
GrabMart demonstrates that grocery delivery can evolve into a scalable, profitable business when built around daily-use behavior.
Its success comes from high-order frequency, data-led pricing, and strong merchant monetization—not one-off transactions.
For founders, the key takeaway is simple: repeat usage, tight unit economics, and subscriptions drive sustainable growth.
FAQs
How much does GrabMart make per transaction?
Typically $2–5 per order after commissions and fees.
What’s GrabMart’s most profitable revenue stream?
Merchant commissions and sponsored listings.
What percentage does GrabMart take from providers?
Around 10–25% depending on merchant category.
How has GrabMart’s revenue model evolved?
Shifted from discounts to subscriptions and ads.
Can small platforms use similar models?
Yes, at a regional or city scale.
What’s the minimum scale for profitability?
Roughly 10,000+ monthly active users per city.
How to implement similar revenue models?
Combine commissions, delivery fees, and ads.
What are alternatives to GrabMart’s model?
Inventory-led or B2B grocery platforms.