


Key Takeaways
- Stripe earns mainly through payment processing fees from online transactions.
- Business tools add revenue through billing, invoicing, fraud protection, and tax services.
- Global payments support growth through cards, wallets, bank transfers, and local methods.
- Enterprise clients increase value with custom pricing and advanced infrastructure needs.
- The model depends on transaction volume, merchants, developers, and digital commerce growth.
What You’ll Learn
- How Stripe makes money through payment infrastructure.
- Transaction fees come from every successful payment processed.
- Subscription billing tools help businesses manage recurring revenue.
- Fraud prevention and tax products create extra monetization layers.
- Revenue growth depends on merchants, payment volume, SaaS adoption, and global expansion.
Real Insights
- Stripe grows when businesses sell online and need reliable payment systems.
- Developer-friendly APIs help Stripe become part of many digital products.
- More payment volume means more revenue through small transaction fees.
- Enterprise adoption improves revenue with larger contracts and custom solutions.
- The best insight is that Stripe earns by powering payments behind modern internet businesses.
Stripe has become one of the most dominant financial infrastructure platforms globally, generating ~$5B+ annual revenue while processing ~$1.4 trillion in payment volume, equivalent to around 1.3% of global GDP scale transactions.
What makes Stripe extraordinary is not just revenue size, but how efficiently it converts massive transaction volume into infrastructure-driven recurring fintech revenue while maintaining relatively thin transaction margins but huge scale advantages.
For founders, Stripe represents the future of programmable finance — where payments, billing, subscriptions, fraud protection, and financial automation become a single integrated monetization ecosystem.
Additional strategic founder insights:
• Infrastructure fintech scales faster than consumer fintech
• Transaction volume matters more than fee percentage
• Developer-first platforms create ecosystem lock-in
• SaaS + Payments = compounding revenue layers
• Embedded payments create recurring transaction dependency
Stripe Revenue Overview – The Big Picture
Revenue Estimate: Stripe generates multi-billion-dollar annual revenue through payment processing fees, enterprise payment infrastructure, billing tools, fraud prevention, financial automation products, and platform-based fintech services.Valuation: ~$90B–$100B+ range
YoY Growth: ~25–30% range
Payment Volume: ~$1.4T yearly
Profitability: Returned to profitability recently and expected to stay profitable
Stripe processes payments at trillion-dollar scale, showing strong adoption among enterprises, SaaS platforms, marketplaces, and digital businesses worldwide. Its continued payment volume growth reflects rising demand for reliable, developer-friendly, and globally scalable payment infrastructure.
Stripe’s valuation remains among the highest in the private fintech sector, supported by strong investor confidence, global payment volume, enterprise adoption, and its role as core payment infrastructure for SaaS platforms, marketplaces, and digital businesses.
Revenue by Segment (Approx Pattern):
• Online Commerce & SaaS: ~50%
• Enterprise Payments: ~25%
• Billing & Subscription Tools: ~15%
• Financial Services (Capital, Issuing, Treasury): ~10%
Competition Benchmark:
• Competes with Adyen, PayPal, Checkout.com, Square
• Strongest developer ecosystem advantage
Primary Revenue Streams Deep Dive
Revenue Stream #1 — Payment Processing Fees
Core revenue engine. Stripe charges merchants per transaction processed.
Share: ~65–70%
Revenue Stream #2 — Billing & Subscription SaaS Tools
Recurring SaaS billing infrastructure for subscription companies.
Share: ~10–15%
Revenue Stream #3 — Financial Services (Capital, Issuing, Treasury)
Loans, cards, banking infrastructure APIs.
Share: ~8–12%
Revenue Stream #4 — Fraud & Risk Tools (Radar)
AI fraud detection sold as value-added layer.
Share: ~5–8%
Revenue Stream #5 — Connect Platform & Marketplace Payments
Revenue from platforms processing payments for sub-merchants.
Share: ~5–10%
Read More: Business Model of Stripe: Revenue, Strategy & Growth 2026
Stripe Revenue Streams Breakdown
| Revenue Stream | Revenue Share | Pricing Model | Growth Driver |
|---|---|---|---|
| Payment Processing | 65–70% | % per transaction | E-commerce growth |
| Billing & SaaS Tools | 10–15% | Subscription pricing | SaaS economy |
| Financial Services APIs | 8–12% | Usage + financing fees | Embedded finance |
| Fraud & Risk Tools | 5–8% | Per transaction + SaaS | AI adoption |
| Platform Payments (Connect) | 5–10% | Volume + platform fee | Marketplace growth |
The Fee Structure Explained
User-Side Fees
Usually invisible. Merchants absorb cost.
Merchant Fees
• Transaction % fee
• Fixed processing fee
• Cross-border fee
• FX conversion fee
Stripe converts roughly ~3% gross payment fee into ~0.40% net revenue take rate after network and partner costs.
Hidden Revenue Layers
• Currency conversion spread
• SaaS billing upsells
• Risk & compliance services
Regional Pricing Variation
• US: Higher card interchange
• EU: Lower regulated fees
• APAC: Growing wallet ecosystem fees
Fee Structure by User Type
| User Type | Fee Type | Typical Range | Revenue Importance |
|---|---|---|---|
| SMB Merchants | Standard Processing | 2–3% total stack cost | Volume driver |
| Enterprise Merchants | Negotiated Fees | 1–2% range | High stability revenue |
| SaaS Platforms | Platform + Processing | Custom tier pricing | High LTV |
| Cross-Border Sellers | FX + Processing | 3–5% blended | High margin |
| Embedded Finance Users | API + Usage | Volume-based | Fastest growth |
How Stripe Maximizes Revenue Per User
Segmentation
Startups → Scaleups → Enterprise → Platforms.
Upselling
Payments → Billing → Fraud → Capital → Issuing.
Cross-Selling
Once integrated, customers adopt multiple Stripe APIs.
Dynamic Pricing
Enterprise custom contracts.
Retention Monetization
Deep API integration makes switching expensive.
LTV Optimization
Platform customers generate multi-product revenue.
Psychological Pricing
Simple transparent pricing attracts developers early.
Cost Structure & Profit Margins
Infrastructure Cost
Cloud, data centers, compliance infra.
Customer Acquisition Cost
Low for developer-led adoption, higher for enterprise sales.
Operations Cost
Risk, compliance, regulatory ops.
R&D Cost
Heavy investment into AI, stablecoins, automation.
Unit Economics
Low margin per transaction but huge volume scale.
Profitability Path
Volume growth → Infrastructure efficiency → Margin expansion.
Read more: Best Stripe Clone Scripts 2025: Build a Scalable Global Payment Infrastructure for Your Startup
Future Revenue Opportunities & Innovations
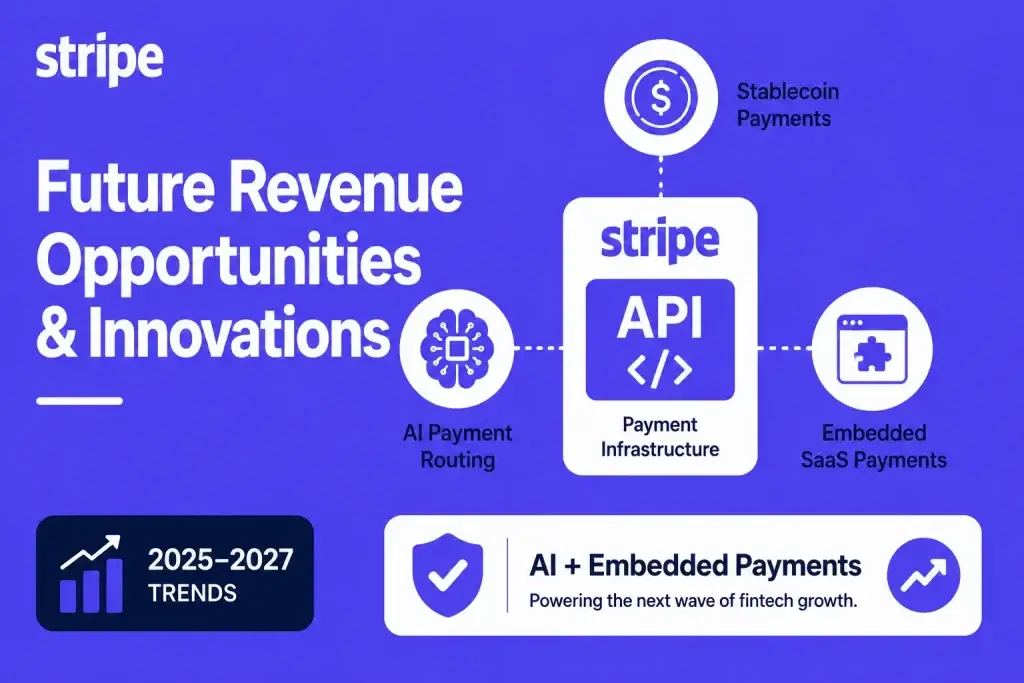
New Revenue Streams
• Stablecoin payments
• AI payment optimization
• Real-time financial automation
AI/ML Monetization
• Fraud prediction
• Smart payment routing
• Revenue analytics APIs
Market Expansion
• Emerging market digital commerce
• SMB financial automation
• Embedded SaaS payments
Predicted Trends 2025–2027
• APIs will dominate fintech monetization
• Embedded finance inside SaaS becomes default
• Infrastructure fintech beats consumer fintech
Risks
• Regulatory fee caps
• Enterprise client concentration
• Big Tech payment competition
Lessons for Entrepreneurs & Your Opportunity
What Works
• Developer-first ecosystem
• Multi-product monetization
• Platform-led payments
What To Replicate
• API-first infrastructure
• Embedded payments
• SaaS + fintech hybrid revenue
Market Gaps
• Regional embedded payment stacks
• Vertical SaaS fintech infra
• SME-friendly programmable payments
Payment infrastructure platforms are custom work at Miracuves, handled by our payment gateway development team. FinTech builds start at $12,999 and typically take 15-30 days, extending to 45-60 days for larger scope. Acquiring partners and PCI DSS compliance are arranged by you.
Related reading: fintech app revenue model breakdown.
Final Thought
Stripe demonstrates that payment infrastructure is one of the strongest recurring fintech revenue models when built around developer ecosystems and programmable financial services.
The future of fintech belongs to platforms that combine payments, banking, lending, and data intelligence into unified programmable layers.
For founders, the biggest insight is simple — owning transaction rails creates long-term revenue compounding and ecosystem lock-in.
FAQs
1. How much does Stripe make per transaction?
Usually small percentage after network fees, roughly ~0.4% net revenue take.
2. What’s Stripe’s most profitable revenue stream?
Payment processing combined with SaaS financial tools.
3. How does Stripe pricing compare to competitors?
Competitive for SMB, custom negotiated for enterprise.
4. What percentage does Stripe take from providers?
Varies widely depending on volume and contract structure.
5. How has Stripe’s model evolved?
From payment processing → full financial infrastructure APIs.
6. Can small platforms use similar models?
Yes, especially through embedded payment APIs.
7. What’s minimum scale for profitability?
Usually requires consistent transaction flow.
8. How to implement similar revenue models?
Payments → Billing → Fraud → Lending → Financial services.
9. What are alternatives to Stripe model?
Payment orchestration, vertical fintech platforms.
Related Articles:
Miracuves is an independent software development company. We are not affiliated with, connected to, sponsored by, or endorsed by any company or product named in this article.
Terms such as “X Clone” are used descriptively. It is how the software industry refers to building a platform with functionality comparable to a known service, and how clients search for it.
The entire design and codebase of our products is built by our own team. Our products contain no code, design, graphics, or content originating from any third-party website or applications.
All third-party names and marks referenced in this article are the property of their respective owners, referenced solely to identify the services discussed.