

Understanding Coupang’s monetization strategy reveals how modern marketplaces can scale massive revenue without sacrificing customer experience. Coupang didn’t grow by simply selling products online—it built an ecosystem where logistics, technology, and data-driven monetization work together to create predictable and repeatable income streams.
What makes Coupang especially interesting for founders is how it balances high operational costs with sustainable margins. By owning last-mile delivery, introducing subscription-based loyalty programs, and layering advertising revenue on top of transactions, Coupang proves that even capital-intensive marketplaces can become profitable with the right monetization mix.
For entrepreneurs planning to build large-scale marketplaces or hyperlocal commerce platforms, Coupang offers a real-world playbook. Its revenue model shows how speed, retention, and multiple monetization layers can coexist—helping platforms grow fast while maintaining efficiency, customer trust, and long-term profitability.
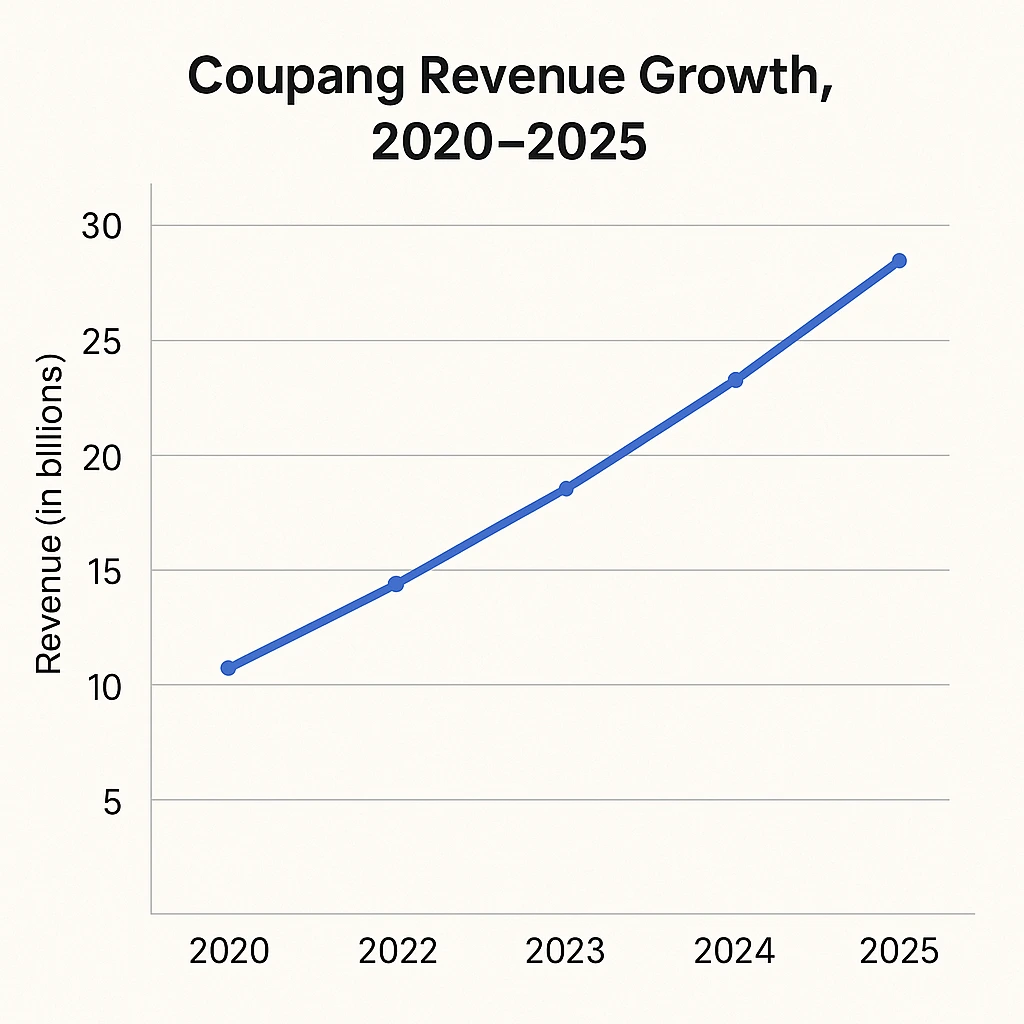
Coupang Revenue Overview – The Big Picture
• 2026 Revenue (projected): ~$28.4B
• 2026 Valuation: ~$45–50B
• YoY Growth: 9–11%
• Revenue by Region:
- South Korea: ~92%
- Taiwan & Japan expansion: ~8%
• Profit Margin: Improving from -2% historically to +3% in 2026 due to logistics efficiency
• Competitors: Amazon, Lazada, Shopee, Flipkart
• Coupang holds a dominant position in South Korea due to its end-to-end logistics (“Rocket Delivery”).
Read More: What is Coupang and How Does It Work?
Primary Revenue Streams Deep Dive
1. Marketplace Sales (First-Party Retail) – ~58%
Coupang buys inventory, stores it, and sells directly to consumers.
• High volume, low margin
• Drives repeat orders
• Average take rate built into product margin (~8–12%)
2. Third-Party Seller Commissions – ~22%
Merchants list products, and Coupang earns commission.
• Commission varies: 7–15%
• FBA-style fulfillment programs increase seller dependency
• Strong margin contribution
3. Rocket WOW Membership – ~8%
Subscription benefits include:
• Free delivery
• Discounts
• Video streaming
2026 pricing: ~$3.60/month
Low price = strong adoption; over 12M subscribers in 2026.
4. Advertising Revenue – ~9%
Sponsored listings, banner ads, search ads.
• $2.2B+ advertising revenue in 2026
• High-margin revenue stream similar to Amazon Ads
5. Logistics & Fulfillment Services – ~3%
3PL-style services for brands:
• Storage
• Packaging
• Delivery
Growth fueled by smaller D2C brands using Coupang’s infrastructure.
Revenue streams percentage breakdown
Marketplace Sales – 58%
Seller Commissions – 22%
WOW Membership – 8%
Advertising – 9%
Fulfillment Services – 3%
The Fee Structure Explained
User-Side Fees
• Membership fee for WOW subscription
• Delivery charges for non-members
• Premium delivery or bulky item fee
Provider-Side Fees
• Commission per sale (7–15%)
• Fulfillment fees: storage, packaging, delivery
• Advertising bidding costs
• Payment processing fees for sellers
Hidden Revenue Layers
• Search placement preference for advertisers
• Inventory turnover penalties
• Optional featured store placement
Regional Differences
• Taiwan & Japan markets have slightly higher delivery fees
• Commission structure remains largely similar across regions
Complete fee structure by user type
| Users | Providers |
|---|---|
| Membership fees | Commission |
| Delivery charges | Fulfillment fees |
| Premium delivery | Ad bidding |
| Return handling fees | Penalties & logistics add-ons |
How Coupang Maximizes Revenue Per User
• Segmentation: Tailored recommendations based on household type, order history, time of day
• Upselling: WOW subscription, premium delivery, bulk offers
• Cross-selling: Grocery + retail bundles
• Dynamic Pricing: AI adjusts prices based on demand, seasonality, and competitor activity
• Retention Monetization: WOW leads to 2–3x higher annual spending
• LTV Optimization: Predictive models target users likely to increase monthly order frequency
• Psychological Pricing: Deep discounts on essentials increase cart size
Real Example:
WOW subscribers spend ~$1,200/year vs ~$600/year for non-members, doubling user-level revenue.
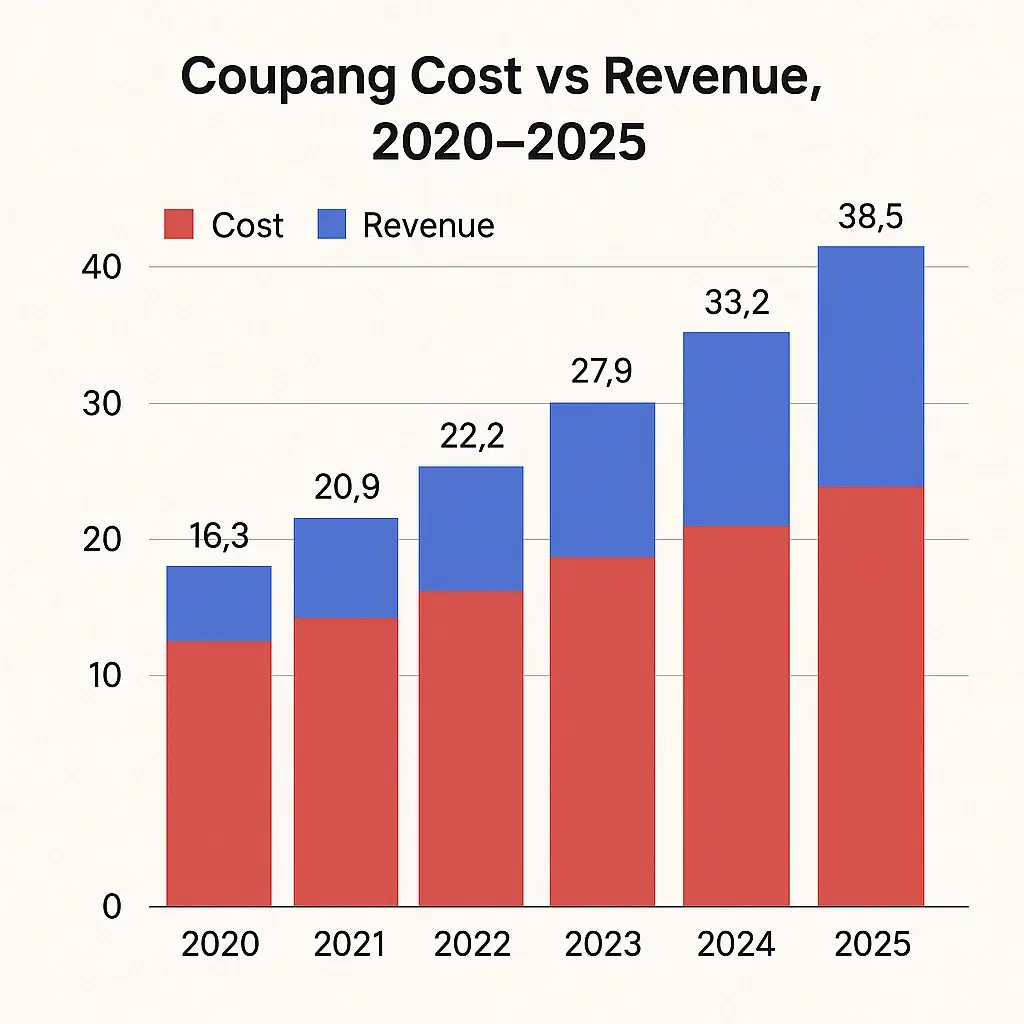
Cost Structure & Profit Margins
Key Cost Drivers
• Tech Infrastructure: AI, recommendation engines, warehouse automation
• Logistics: Delivery centers, fleet, packaging
• Marketing & CAC: Performance ads, seller acquisition
• Operations: Staff, customer service
• R&D: Robotics, machine learning for dispatch optimization
Unit Economics
• Average delivery cost: ~$2.10
• Average margin after logistics: 3–8% depending on category
• Advertising revenue subsidizes free shipping programs
Profitability Path:
Coupang’s margin structure improves as order density grows in each delivery region.
Future Revenue Opportunities & Innovations
• AI-driven logistics monetization for third-party sellers
• Drones + autonomous vans for last-mile cost reduction
• Fintech expansion: Seller credit, BNPL, wallet system
• Cross-border commerce: Japan–Korea–Taiwan corridor
• Coupang Ads 2.0: Advanced targeting, video ads
• Private-label expansion: Higher-margin categories
• New groceries & perishables programs
• Risks: Regulatory pressure, thin margins, regional saturation
Read More: Best Coupang Clone Script 2025 | Scalable E-Commerce Solution
Lessons for Entrepreneurs & Your Opportunity
What Works
• Fast delivery as a competitive moat
• Integrated logistics
• Low-cost subscription = high retention
• Personalized recommendations
What to Replicate
• Ad-based monetization
• Mixed marketplace + first-party retail
• Predictive logistics
Market Gaps
• Localized hyper-delivery models
• Vertical-specific flash commerce
• Niche subscription programs
Model Improvements for Founders
• Add gamified loyalty programs
• Enable micro-fulfillment centers
• Use AI-driven replenishment reminders.
To put this into practice, our ready-made multi-vendor marketplace platform starts at $2,799 and is delivered in 6 days. It includes its own delivery agent app, so your fleet completes the last mile. It is not a copy of Coupang.
Related reading: e-commerce marketplace security guide.
Final Thought
Coupang’s revenue model proves that efficiency and monetization can scale together when logistics, data, and retention strategies are tightly aligned. Its success shows that modern marketplaces are no longer just about product listings—they are about building end-to-end systems that optimize speed, trust, and lifetime value.
For entrepreneurs and businesses working with Miracuves, Coupang serves as a blueprint for designing platforms that monetize at multiple levels from day one. By combining marketplace commissions, subscriptions, advertising, and fulfillment services, founders can create resilient revenue engines that grow stronger as user activity increases.
Miracuves helps translate these proven strategies into real, launch-ready platforms. Whether you’re building a hyperlocal marketplace or a large-scale eCommerce ecosystem, Miracuves enables you to implement scalable monetization, operational efficiency, and growth-ready architecture—so your platform is built not just to launch, but to sustain and scale profitably.
FAQs
1. How much does Coupang make per transaction?
Around 7–15% via commissions, plus margin on first-party goods.
2. What’s Coupang’s most profitable revenue stream?
Advertising and memberships due to high margins.
3. How does Coupang’s pricing compare to competitors?
Generally lower than Amazon and similar to Shopee/Lazada.
4. What percentage does Coupang take from providers?
Typically 7–15% depending on product category.
5. How has Coupang’s revenue model evolved?
Shifted from pure retail to commissions, ads, and subscription revenue.
6. Can small platforms use similar models?
Yes, especially commission + membership + ads.
7. What’s the minimum scale for profitability?
Around 15–20K monthly transactions depending on region.
8. How to implement similar revenue models?
Use mixed monetization: commission, ads, subscription, logistics.
9. What are alternatives to Coupang’s model?
Pure marketplace, D2C aggregator, wholesaler-led retail, or hyperlocal commerce.
Miracuves is an independent software development company. We are not affiliated with, connected to, sponsored by, or endorsed by any company or product named in this article.
Terms such as “X Clone” are used descriptively. It is how the software industry refers to building a platform with functionality comparable to a known service, and how clients search for it.
The entire design and codebase of our products is built by our own team. Our products contain no code, design, graphics, or content originating from any third-party website or applications.
All third-party names and marks referenced in this article are the property of their respective owners, referenced solely to identify the services discussed.