
Key Takeaways
What You’ll Learn
- Tokopedia’s revenue model is built around marketplace-driven eCommerce connecting buyers, sellers, logistics providers, and digital payment services through a scalable online commerce ecosystem.
- The platform earns through multiple monetization streams including marketplace commissions, advertising, logistics services, fintech integrations, digital payments, and merchant tools.
- Marketplace scalability is Tokopedia’s biggest advantage because millions of sellers and products continuously expand platform activity and customer engagement.
- Integrated fintech and payment systems improve retention through digital wallets, payment processing, financial services, and seamless online transaction experiences.
- The biggest takeaway for founders is that marketplace platforms scale successfully when seller ecosystems, digital payments, logistics, and customer convenience work together.
Stats That Matter
- The article positions Tokopedia as a large-scale digital commerce ecosystem focused on marketplace retail, digital payments, seller enablement, and eCommerce infrastructure.
- Core revenue comes from marketplace transactions and seller services including commissions, promoted listings, advertising placements, and merchant subscriptions.
- Additional monetization comes from fintech and logistics integrations supporting payments, delivery coordination, financing services, and operational commerce infrastructure.
- The platform benefits from rapid digital commerce adoption as businesses and consumers increasingly rely on mobile-first online shopping experiences.
- Tokopedia’s ecosystem strategy improves long-term scalability because sellers, logistics providers, payment systems, and merchants all contribute to platform growth.
Real Insights
- Tokopedia succeeds because it combines marketplace commerce with digital financial infrastructure creating a connected ecosystem for buyers, sellers, and merchants.
- The strongest growth driver is seller ecosystem expansion because more merchants increase product variety, marketplace activity, and customer retention.
- Integrated payments and logistics improve operational efficiency since seamless transactions and delivery coordination strongly influence eCommerce success.
- Mobile-first infrastructure directly affects scalability because modern consumers increasingly rely on smartphones for digital commerce and online transactions.
- For entrepreneurs, the biggest lesson is to build a Tokopedia-style marketplace platform around seller ecosystems, digital payments, scalable logistics, marketplace monetization, and mobile-first commerce infrastructure.
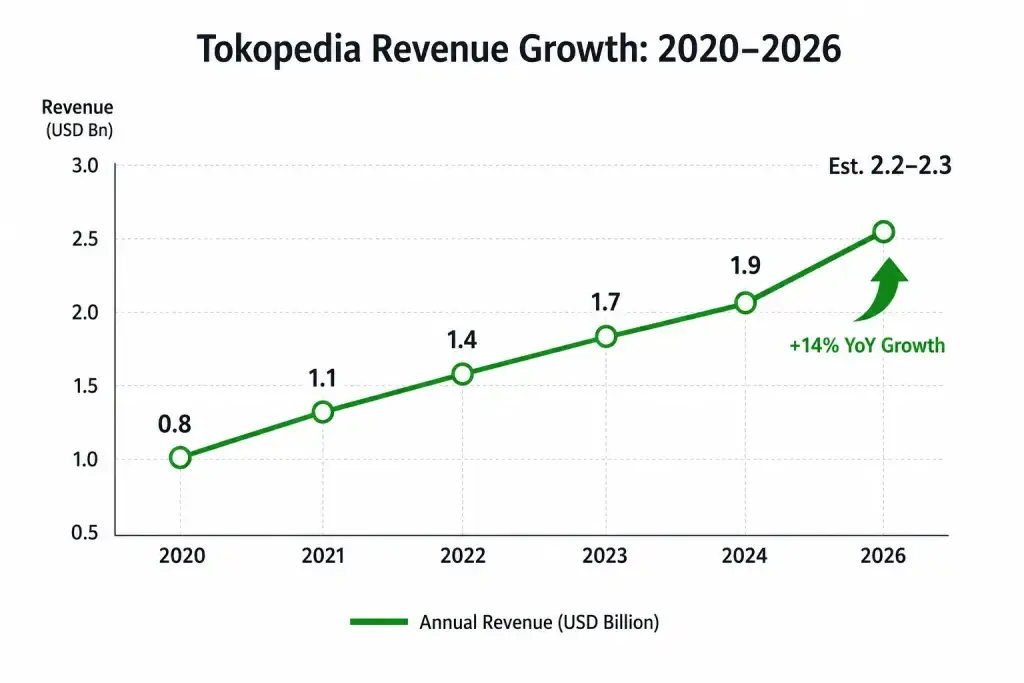
In 2026, Tokopedia contributes to over $2.1 billion in annual platform revenue, making it one of Southeast Asia’s most powerful marketplace engines. This scale is driven by mass SME onboarding, high-frequency consumer purchases, and strong category diversification across electronics, fashion, groceries, and digital goods. Its ability to monetize transactions without heavy inventory risk keeps margins resilient even during market fluctuations.
Tokopedia isn’t just an online marketplace—it’s a multi-layered monetization machine built on millions of active SMEs, repeat buyers, and embedded services. Beyond transaction commissions, the platform generates significant income from seller advertising, logistics integrations, digital products, and financial services, allowing it to earn revenue at multiple points in a single user journey.
For founders, understanding Tokopedia’s revenue model reveals how marketplaces scale profitably in emerging markets by prioritizing seller success, low entry barriers, and optional paid growth tools. The model proves that sustainable marketplace revenue comes from ecosystem design, not aggressive fee extraction, making it highly replicable for region-focused or vertical-specific platforms.
Tokopedia Revenue Overview – The Big Picture
Tokopedia operates as a multi-sided marketplace under the GoTo ecosystem, monetizing sellers, buyers, and brands simultaneously.
2026 Snapshot
- Estimated 2026 Revenue: ~$2.1–2.3 billion
- Valuation (GoTo ecosystem share): ~$18–20 billion
- YoY Revenue Growth: ~14% (2024–2026)
- Primary Markets: Indonesia (≈90%), Southeast Asia cross-border
- Average Gross Margin: 22–26%
- Profitability Status: Contribution-margin positive, group-level EBITDA improving
Revenue by Region
- Indonesia: ~90%
- Cross-border sellers (China, SEA): ~7%
- Digital services & others: ~3%
Competition Benchmark
- Shopee: Higher GMV, lower margins
- Lazada: Higher logistics cost
- Tokopedia: Strong SME monetization + ads efficiency
Read More: What is Tokopedia and How Does It Work?
Primary Revenue Streams – Deep Dive
Revenue Stream #1: Seller Commissions
Tokopedia charges sellers a commission per successful transaction depending on category.
- Commission Rate: 1%–6%
- Revenue Share: ~38%
- 2026 Contribution: ~$800M+
- Higher-margin categories include electronics, fashion, and digital goods.
Revenue Stream #2: Sponsored Ads & Product Boosting
Sellers pay to boost product visibility within search and category listings.
Revenue Stream #3: Logistics & Fulfillment Fees
Tokopedia earns margins through integrated logistics partnerships and fulfillment services.
- Revenue Share: ~15%
- 2026 Contribution: ~$320M
- Includes warehousing, same-day delivery, and seller shipping tools.
Revenue Stream #4: Digital Products & Services
Includes mobile top-ups, utility payments, tickets, subscriptions, and digital vouchers.
- Revenue Share: ~12%
- 2026 Contribution: ~$250M
- Low CAC, high repeat usage.
Revenue Stream #5: Financial & Merchant Services
Includes seller loans, BNPL partnerships, payment facilitation, and wallet integrations.
- Revenue Share: ~8%
- 2026 Contribution: ~$170M
- High LTV, strong retention driver.
Revenue Streams Breakdown
| Revenue Stream | % Share |
|---|---|
| Seller Commissions | 38% |
| Sponsored Ads | 27% |
| Logistics & Fulfillment | 15% |
| Digital Products | 12% |
| Financial Services | 8% |
The Fee Structure Explained
Tokopedia’s strength lies in layered, flexible fees rather than heavy upfront charges.
User-Side Fees
- Free browsing & signup
- Delivery fees (variable)
- Convenience fees on digital services
Provider-Side Fees
- Transaction commission
- Ad spend (optional but competitive)
- Fulfillment service fees
Hidden Revenue Layers
- Float income on wallets
- Merchant financing partnerships
- Data-driven ad optimization margins
Regional Pricing
- Lower commissions for new sellers
- Category-based fee variation
Fee Structure Table
| User Type | Fee Type | Typical Range |
|---|---|---|
| Buyers | Service & delivery | 1–4% |
| Sellers | Commission | 1–6% |
| Sellers | Ads | CPC/CPM |
| Merchants | Fulfillment | Per order |
| Partners | Financial services | Revenue share |
How Tokopedia Maximizes Revenue Per User
Tokopedia focuses on lifetime value, not one-time transactions.
- Segmentation: Power sellers vs casual sellers
- Upselling: Premium seller tools & ads
- Cross-selling: Logistics + payments + ads
- Dynamic Pricing: Category-based commission tuning
- Retention Monetization: Wallet credits & subscriptions
- Psychological Pricing: Low commissions, visible ROI ads
Real Example (2026):
Top 20% sellers contribute nearly 65% of ad revenue, proving the power of seller-focused monetization.
Cost Structure & Profit Margins
Tokopedia’s margins improve as scale increases.
Cost Breakdown
- Infrastructure & Cloud: ~22%
- Marketing & CAC: ~28%
- Operations & Support: ~18%
- R&D & Product: ~12%
Unit Economics
- Average order contribution margin: 18–24%
- Ads & financial services offset logistics costs
Profitability Path
- Ads + fintech → margin expansion
- Logistics → efficiency over scale
Read More: Best Tokopedia Clone Scripts 2025 | A Multi-Vendor Marketplace
Future Revenue Opportunities & Innovations
New Revenue Streams
- AI-powered seller ads
- Cross-border seller enablement
- Subscription-based seller tiers
AI/ML Monetization
- Smart pricing recommendations
- Conversion-optimized ad bidding
Market Expansion
- Tier-2 & Tier-3 cities
- Regional ASEAN sellers
2026–2027 Trends
- Ads-first marketplaces
- Embedded finance growth
- Faster fulfillment expectations
Risks
- Price wars
- Logistics inflation
- Regulatory fintech pressure
Opportunities for Founders
- Vertical marketplaces
- SME-focused platforms
- Regional-first commerce apps
Lessons for Entrepreneurs & Your Opportunity
What Works
- Multi-layer monetization
- Seller-first growth strategy
- Ads as profit engine
What to Replicate
- Low entry barrier + optional upsells
- Integrated payments & logistics
Market Gaps
- Niche vertical marketplaces
- Local-language commerce platforms
Founder Improvements
- Faster seller onboarding
- AI-driven pricing tools
Final Thought
Tokopedia proves that marketplaces don’t win by charging more—they win by charging smarter. Instead of relying on high commissions, it uses low base fees combined with optional, performance-driven monetization such as sponsored listings, logistics services, and financial tools, ensuring sellers only pay more as they grow.
Its success comes from carefully balancing seller growth, buyer trust, and layered monetization. Tokopedia invests in seller education, reliable fulfillment, and transparent pricing, while monetizing through ads, value-added services, and repeat usage, creating a system where growth for one side of the marketplace fuels revenue across the entire platform.
For founders, this model shows how sustainable revenue emerges from ecosystem thinking rather than short-term extraction. By designing platforms that help sellers succeed first and monetizing through optional enhancements, entrepreneurs can build long-lasting marketplaces with higher retention, healthier margins, and compounding network effects.
FAQs
1. How much does Tokopedia make per transaction?
Typically 1–6% in commission, plus optional ad and logistics margins.
2. What’s Tokopedia’s most profitable revenue stream?
Sponsored ads and merchant services.
3. How does Tokopedia’s pricing compare to competitors?
Lower base commissions but higher optional monetization.
4. What percentage does Tokopedia take from providers?
On average, 3–5% per transaction.
5. How has Tokopedia’s revenue model evolved?
From pure commissions to ads-first monetization.
6. Can small platforms use similar models?
Yes, especially niche or regional marketplaces.
7. What’s the minimum scale for profitability?
Typically 50K–100K monthly active buyers.
8. How to implement similar revenue models?
Start with commissions, then layer ads and services.
9. What are alternatives to Tokopedia’s model?
Subscription-led or inventory-based commerce.
Miracuves is an independent software development company. We are not affiliated with, connected to, sponsored by, or endorsed by any company or product named in this article.
Terms such as “X Clone” are used descriptively. It is how the software industry refers to building a platform with functionality comparable to a known service, and how clients search for it.
The entire design and codebase of our products is built by our own team. Our products contain no code, design, graphics, or content originating from any third-party website or applications.
All third-party names and marks referenced in this article are the property of their respective owners, referenced solely to identify the services discussed.