


Key Takeaways
- Rental yield shows the income a property generates compared with its value or investment cost, while capital appreciation reflects changes in property value over time.
- A fractional real estate investment platform should display rental income and potential property value growth separately so investors can evaluate both return sources.
- Investors need clear information about property expenses, occupancy, management fees and market conditions before comparing investment opportunities.
- Projected returns should be clearly distinguished from actual performance because rental income and property appreciation are not guaranteed.
Rental Yield and Capital Appreciation Comparison
- Rental yield calculations should identify whether they use gross rental income or net income after operating expenses and management charges.
- Capital appreciation estimates should show the property’s purchase value, current valuation and assumptions used to estimate future growth.
- Property comparison dashboards should present rental yield, valuation changes, investment costs and expected holding periods using consistent calculation methods.
- Investors should be able to understand how vacancies, maintenance expenses and changing property prices can affect their overall investment returns.
Investor Reporting and Return Transparency
- Investor dashboards should separately display rental distributions received, outstanding income and changes in the estimated value of each property investment.
- Platforms should explain how ownership percentage, property expenses, platform fees and taxes may influence an investor’s actual returns.
- Historical performance, valuation dates and projected return scenarios should be clearly labeled to help investors distinguish verified results from estimates.
- Clear reporting on rental income, property appreciation, liquidity limitations and exit costs helps investors make more informed long-term investment decisions.
Fractional real estate platforms are not only about listing attractive properties. They are about helping investors understand what kind of return they are actually looking at.
Some investors care about regular rental income. Others are more focused on long-term property value growth. Many want both, but they may not know how to compare them clearly. That is why a fractional real estate investment platform should not present returns as one simplified number. It should separate rental yield, capital appreciation, total return, risk assumptions, distribution history, and exit visibility.
Rental yield is commonly understood as annual rental income compared with property value, while net yield adjusts for expenses such as maintenance, insurance, vacancy, and operating costs. Capital appreciation, also called capital growth, reflects how much a property or portfolio increases or decreases in value over time.
For founders building a property investment platform, this distinction matters. If investors cannot understand where returns come from, they may hesitate before investing, misunderstand performance, or lose trust when projections change. A strong investor dashboard should make the difference between income and growth obvious from the first property card.
Why Rental Yield and Capital Appreciation Should Not Be Mixed Together
Rental yield and capital appreciation are both part of real estate investment returns, but they answer different questions.
Rental yield answers: “How much income can this property generate compared with its value?”
Capital appreciation answers: “How much could this property increase in value over time?”
When a platform blends both into one headline number, investors may not understand whether the return depends on rent collection, future resale value, occupancy, market growth, currency movement, or exit timing. That creates a transparency problem.
For example, two properties may show similar projected total returns, but they may behave very differently:
| Property Type | Rental Yield Profile | Capital Appreciation Profile | Investor Fit |
|---|---|---|---|
| Income-focused apartment | Higher recurring rent | Moderate long-term growth | Investors seeking regular distributions |
| Prime-location property | Lower current yield | Higher potential appreciation | Investors seeking long-term value growth |
| Short-term rental asset | Variable income | Market-dependent value | Investors comfortable with occupancy swings |
| Development-linked asset | Low early income | Higher appreciation potential | Investors with longer holding periods |
This return split also shapes the fractional property investment business model, because platform operators need to explain how rental income, appreciation potential, platform fees, resale activity, and investor distributions work together.
A fractional platform should help investors understand this tradeoff instead of hiding it behind one simple return label.
What Rental Yield Should Show on a Fractional Real Estate Platform
Rental yield should be displayed as a practical income metric, not as marketing decoration.
At the property level, the platform should show both gross and net yield where possible. Gross rental yield is easier to understand because it compares annual rent with property value. Net yield is more useful for decision-making because it deducts relevant costs and gives a more realistic income picture.
A strong investor-facing property card should include:
- Expected annual rental income
- Gross rental yield
- Estimated expenses
- Net rental yield
- Occupancy assumption
- Distribution frequency
- Historical rent collected, if available
- Next expected distribution date
- Currency in which distributions are paid
The key is not only showing the yield percentage. The platform should also show how that percentage was calculated.
Example Rental Yield Display
| Metric | What Investors See | Why It Matters |
|---|---|---|
| Annual rental income | Expected yearly rent from the property | Helps investors understand income potential |
| Gross yield | Rent compared with property value before expenses | Gives a quick comparison point |
| Net yield | Rent after operating costs | Shows a more realistic income return |
| Occupancy assumption | Expected rented period | Explains income reliability |
| Distribution schedule | Monthly, quarterly, or annual payout timing | Helps investors plan cash flow |
This creates clarity for income-focused investors who care about recurring returns.
What Capital Appreciation Should Show Investors
In crowdfunding-style property investment models, ownership structure also affects how investors understand valuation, income rights, and exit options. That is why founders should understand how SPVs work in real estate crowdfunding before presenting ownership shares, appreciation logic, and resale assumptions inside the platform.
Capital appreciation is more uncertain than rental income because it depends on property valuation, local demand, infrastructure development, market liquidity, interest rates, and exit timing.
That does not mean platforms should avoid showing appreciation. It means they should show it carefully.
A fractional real estate investment platform should explain:
- Current property valuation
- Purchase price or acquisition price
- Projected valuation growth
- Valuation method
- Last valuation date
- Expected holding period
- Comparable market logic, if available
- Exit assumptions
- Secondary market availability
Capital appreciation should not be presented as a guaranteed outcome. It should be shown as a projection, scenario, or potential upside with clear assumptions.
Appreciation Display Example
| Appreciation Data Point | Investor Benefit |
|---|---|
| Current valuation | Shows today’s estimated property value |
| Acquisition price | Helps investors see entry-point logic |
| Projected value range | Avoids false certainty around future pricing |
| Last valuation date | Shows whether the estimate is current |
| Valuation source or method | Improves trust in the number |
| Exit assumption | Connects appreciation to liquidity planning |
Investors may accept uncertainty when the platform explains it clearly. What damages trust is presenting future value growth as if it is fixed.
Why Total Return Needs a Separate Section
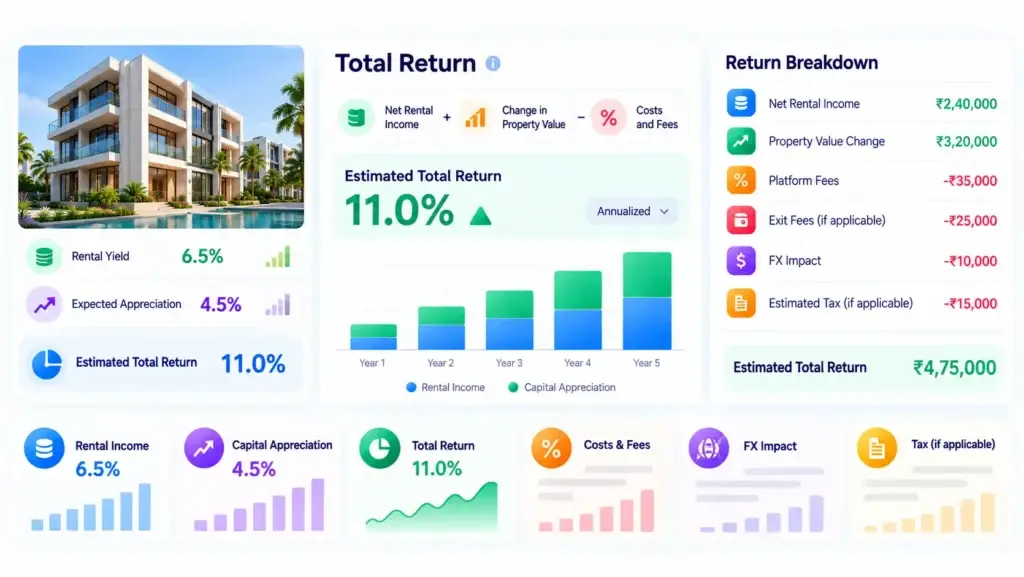
Total return combines rental income and capital appreciation. It is useful, but it should not replace the separate display of yield and appreciation.
A clean platform experience may show:
Total Return = Net Rental Income + Change in Property Value – Costs and Fees
This gives investors a full-picture view while still allowing them to inspect each component.
A responsible total return section should include:
- Net rental distributions received
- Unrealized property value movement
- Platform fees
- Exit fees, if applicable
- FX impact, if cross-border investment is supported
- Tax caveat, where relevant
- Realized vs unrealized gains
This matters because rental yield may be paid periodically, while capital appreciation may remain unrealized until sale or exit. Treating both as equal cash returns can mislead investors.
How Investor Dashboards Should Compare Income and Growth
A good fractional property dashboard should not make investors dig through reports to understand performance. It should create a clear split between income, growth, and liquidity.
Here is a useful dashboard structure:
| Dashboard Section | What It Should Show | Founder Impact |
|---|---|---|
| Income Performance | Rent collected, net yield, distributions paid | Builds confidence in recurring returns |
| Growth Performance | Current valuation, appreciation, projected value | Helps investors understand long-term upside |
| Portfolio Summary | Total invested, income earned, unrealized gains | Improves retention and repeat investment |
| Property Assumptions | Occupancy, expenses, valuation date, hold period | Reduces confusion and support requests |
| Exit Visibility | Secondary market status, estimated resale value | Helps investors understand liquidity options |
These dashboard layers are not just reporting elements; they are core fractional real estate platform features that help investors compare income performance, property growth, distribution history, valuation updates, and exit visibility from one place.
This is especially important in fractional ownership because investors are not buying the entire property. They are buying a share of an asset and relying on the platform to explain performance clearly.
Behind that investor experience, the fractional real estate investment platform architecture must connect property data, investor records, wallet activity, valuation updates, rental distributions, ownership tracking, and admin-side reporting without making the front-end experience feel complex.
Founder Decision Signals: What Should Your Platform Prioritize?
Investor Trust
If return data is unclear, investors may hesitate even when the property itself is attractive. Clear yield and appreciation sections reduce uncertainty.
Regulatory Readiness
Return projections should be presented with assumptions, caveats, and audit-friendly records so the platform can support review workflows.
Portfolio Retention
Investors who understand income, growth, and distributions are more likely to track performance and reinvest.
Operational Efficiency
A well-structured dashboard reduces repeated support questions about rent, valuation, fees, and payout timing.
What Not to Show as a Single Headline Number
Many early-stage platforms make the mistake of over-simplifying return data. They may show one projected return number at the top of the listing and leave the details buried below.
That approach can increase clicks, but it can weaken trust.
Avoid showing:
- One blended return percentage without calculation logic
- Capital appreciation as guaranteed growth
- Gross yield without net yield context
- Rental income without vacancy assumptions
- Total return without fees
- Exit value without liquidity conditions
- Cross-border returns without FX impact
- Portfolio performance without separating realized and unrealized returns
Investors do not need every financial model on the first screen. But they do need enough clarity to know what the platform is actually projecting.
How to Present Risk Without Hurting Conversions
Risk disclosure does not have to reduce conversions. In many cases, it improves conversion quality because serious investors appreciate transparent assumptions.
A practical risk section can explain:
- Rental income may vary based on occupancy and market rent
- Property valuations may move up or down
- Exit timing depends on buyer demand or platform liquidity
- Fees may affect net return
- Currency conversion may affect cross-border distributions
- Tax treatment depends on investor location and professional advice
The goal is not to scare users away. The goal is to set expectations clearly.
A platform that explains both upside and uncertainty feels more mature than one that only highlights projected gains.
The Role of Secondary Market Visibility
Fractional real estate investors often ask one important question: “How do I exit?”
That is where secondary market visibility becomes important. Rental yield may provide ongoing income, but capital appreciation usually becomes meaningful only when the investor can sell the share or when the underlying asset is sold.
A platform should show:
- Whether the property share is eligible for resale
- Estimated resale value
- Last traded price, if available
- Listing status
- Buyer demand indicators
- Exit fees
- Lock-in period, if any
- Expected settlement timeline
This connects capital appreciation to practical liquidity. Without exit visibility, appreciation remains theoretical.
What a Better Property Listing Card Could Include
A property listing card should help investors compare opportunities quickly without oversimplifying the investment.
A strong card might include:
| Field | Example Label |
|---|---|
| Net rental yield | “Estimated net annual yield” |
| Appreciation range | “Projected value growth range” |
| Total projected return | “Estimated total return, before tax” |
| Distribution schedule | “Quarterly rental distributions” |
| Occupancy assumption | “Based on projected occupancy” |
| Holding period | “Target hold: 3–5 years” |
| Exit option | “Secondary market eligible” |
| Risk label | “Income-focused / growth-focused / balanced” |
This gives investors a clear first impression: is this property mainly an income opportunity, a growth opportunity, or a balanced opportunity?
Why Platform Operators Need Admin Control Over Return Assumptions
The more advanced these investor, payout, valuation, and admin modules become, the more important it is to evaluate the fractional real estate app development cost based on actual platform scope rather than only front-end screens.
Investor-facing numbers should not be hard-coded. A white-label fractional real estate platform should give property operators admin control over assumptions, projections, documents, valuation updates, payout records, investor notices, and return-related disclaimers.
For example, the admin side should allow platform teams to update:
- Rental assumptions
- Expense estimates
- Net yield logic
- Valuation dates
- Property documents
- Distribution batches
- Fee rules
- Currency settings
- Exit availability
- Investor communication notes
This matters because real estate performance changes over time. A platform that cannot update return assumptions cleanly may create investor confusion and operational risk.
Miracuves builds launch-ready fractional real estate platform foundations with investor dashboards, admin controls, source-code ownership, and deployment support. For ready-made solutions, Miracuves can support a faster 6-day launch path when the selected scope matches the base build.
Mistakes Founders Should Avoid
Showing only projected total return
Total return is useful, but investors need to understand how much comes from rental income and how much depends on future valuation growth.
Hiding net yield behind gross yield
Gross yield may look attractive, but net yield gives a more realistic view after expenses and operating assumptions.
Treating appreciation as guaranteed
Capital appreciation should be shown as a projection or scenario, not a fixed outcome.
Ignoring exit visibility
If investors cannot understand how they may exit, appreciation numbers may feel theoretical rather than actionable.
Final Thoughts: Investors Need Return Clarity, Not Just Property Access
The strongest fractional real estate platforms do more than give investors access to property shares. They help investors understand the return profile behind each asset.
Rental yield shows income potential. Capital appreciation shows long-term value movement. Total return connects both, but only when the platform explains assumptions, fees, risks, and exit conditions clearly.
For founders, this is not only a dashboard design decision. It is a trust decision. A platform that separates income, growth, distributions, and liquidity gives investors a clearer reason to invest and a stronger reason to return.
Miracuves helps founders build white-label fractional property investment platforms with the investor, admin, portfolio, and reporting workflows needed to support this level of clarity from launch.
FAQs
What is the difference between rental yield and capital appreciation?
Rental yield measures the income a property generates compared with its value. Capital appreciation measures how much the property’s value increases or decreases over time. A good fractional real estate platform should show both separately.
Should fractional real estate platforms show gross yield or net yield?
They should ideally show both. Gross yield is useful for quick comparison, but net yield is more practical because it accounts for expenses and gives investors a clearer income picture.
Why should capital appreciation not be shown as guaranteed?
Property values can change based on demand, location, interest rates, infrastructure, liquidity, and broader market conditions. Appreciation should be presented as a projection or scenario, not a guaranteed return.
What is total return in fractional real estate investing?
Total return combines rental income, property value movement, and relevant costs or fees. It gives investors a broader view of performance, but it should still separate realized income from unrealized gains.
What should an investor dashboard show for rental income?
An investor dashboard should show rent collected, distribution history, net yield, expected payout dates, expenses, occupancy assumptions, and property-level performance.
Why does exit visibility matter in fractional ownership?
Exit visibility helps investors understand whether they can resell their share, what the estimated resale value may be, and whether liquidity depends on a secondary market or full property sale.
How can founders make property investment returns easier to understand?
Founders can use clear dashboards, separate income and growth metrics, explain assumptions, show fees transparently, and provide property-level documents, valuation dates, and distribution records.
Can Miracuves help build a fractional real estate investment platform?
Yes. Miracuves helps founders launch white-label fractional real estate platforms with investor dashboards, admin control, portfolio tracking, source-code ownership, and faster deployment options based on the selected scope.
Miracuves is an independent software development company. We are not affiliated with, connected to, sponsored by, or endorsed by any company or product named in this article.
Terms such as “X Clone” are used descriptively. It is how the software industry refers to building a platform with functionality comparable to a known service, and how clients search for it.
The entire design and codebase of our products is built by our own team. Our products contain no code, design, graphics, or content originating from any third-party website or applications.
All third-party names and marks referenced in this article are the property of their respective owners, referenced solely to identify the services discussed.