
Key Takeaways
- Three vendors quote three different numbers because each one silently invents the operation you failed to describe.
- Peak orders per hour decides fleet size, assignment design and tracking load; the daily total decides nothing.
- Rider cost per hour divided by realistic drops per hour produces cost per delivery, the figure everything else hangs from.
- Prep time variance, not the average, is a build requirement: a kitchen ranging from eight to thirty five minutes cannot be timed, only reacted to.
- Your expected cash share decides whether float, rider balances and shift settlement ship at launch or get retrofitted into a live ledger.
Measure Before You Scope
- Count orders leaving two kitchens for a full week and record the busiest single hour.
- Time the widest crossing of your intended zone at peak, then again at the quiet hour.
- Get a month of tickets from three restaurants and plot the basket spread, not the average.
- Hire one rider for two peak evenings and time every leg, including the wait at the counter.
- Write down your expected cash share before anyone designs the money path.
Real Insights
- A quote is a model of an operation with a price printed on the front, and the model is yours to supply.
- Zones behave like time rather than geography, so peak travel time draws the map before any boundary is agreed.
- The share of baskets below break-even decides whether minimum orders, small order fees and batching are launch features.
- Total addressable market, competitor feature lists and city population change no engineering decision at all.
- Miracuves works from that measurement sheet rather than a feature checklist, and once the numbers are on the table eligible ready-made dispatch scopes follow the 6-day delivery path for build and white-labelling.
Three vendors have quoted the same food delivery dispatch app, and the numbers are not close. They describe different amounts of work. The founder reads all three again, looking for the line that explains the gap, and does not find it, because it is not in any of them.
The gap is about what each vendor had to imagine when nobody told them anything. One pictured forty orders a day across four streets, card only, all delivery. Another pictured a busy evening across a city with scheduled office orders, a cash share, and riders paid per hour whether orders arrive or not. Both priced the operation they imagined.
There is a short list of measurements only the operator can produce. Until those exist, every estimate is a guess wearing a decimal point, including the cheap one. This article is that list, what each number decides inside the build, and the cheapest honest way to measure it before you own a platform.
Nobody can price a platform against Grubhub without the eight numbers that describe your actual operation.
Why Three Vendors Quote Three Different Dispatch Platforms
Three vendors quoting a Grubhub-style platform are answering three different questions, because only one was asked.
Each quote is usually internally honest. A team that has built dispatch before knows the effort does not scale with the number of screens. It scales with concurrency, with how many assignment decisions happen inside the same sixty seconds, and with how many routes the money can take.
Every quote contains an imagined operation
A quote for a food delivery dispatch app is a model of an operation with the price printed on the front. When the brief says “a food delivery app for my city”, the vendor fills in the rest of the model from habit. The habit differs by vendor, which is exactly why the numbers differ.
You can usually reverse the arithmetic. A quote that assumes low concurrency treats assignment as a simple queue. One that assumes cash carries a float and reconciliation. None of that is visible on the invoice, and all of it is visible in the delivery.
What a vendor does when you give them nothing
Given no numbers, a vendor has two defensible moves. Pad wide to cover the worst plausible operation, which produces a large number and loses the deal. Or quote the smallest coherent build and let the rest arrive later as change requests, which produces a small number and wins it.
You are not choosing between an honest vendor and a dishonest one. You are choosing between two guesses about you. The development cost page sets out what is being priced. The inputs are yours to supply, and nobody else can.
Peak Orders Per Hour Sizes a Delivery Dispatch Build
Almost every founder arrives with a daily number. Four hundred orders a day sounds like a measurement and behaves like one in a spreadsheet. It sizes nothing, because a dispatch system never experiences a day. It experiences the worst ninety minutes of one.
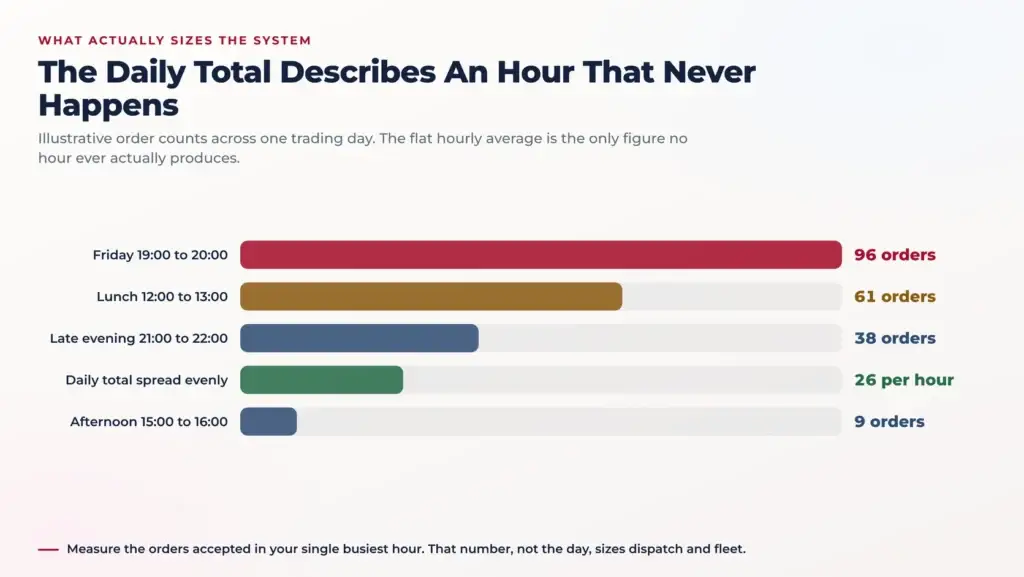
Image Source: AI-generated visual by Miracuves
The daily total is an average of an average
Spread four hundred orders evenly over a trading day and you get a comfortable hourly rate no hour ever sees. Food demand has two spikes with a long trough between them, and one spike is larger on exactly the nights you most want to look competent.
The number that matters is the count of orders accepted in your busiest single hour, and ideally the busiest fifteen minutes inside it. Friday between seven and half past eight is where most operators find it. That figure is what the system has to survive.
What the peak actually sizes
Peak orders per hour, divided by the drops a rider completes in an hour, gives the minimum number of riders who must be online at once. That division decides fleet cost, recruitment targets and whether the operation can exist in the zone you picked.
It also decides system behaviour. Assignment saturates first: at low concurrency a naive loop is fine, and at high concurrency you need offers, timeouts, re-offers and backpressure. How to Build an App Like Grubhub: Inside the Food Delivery Dispatch Engine covers that machinery. Your peak decides whether you need it on day one.
Peak also sets the tracking load, because every rider online is emitting location and every watching customer holds a live connection. Sub-2 Second Tracking: Load-Testing GPS Delivery Updates on Flutter and Laravel shows what that costs. You cannot load test against a daily total.
Travel Time Across Your Area at the Hour You Operate
The second number is a duration, not a distance. How long does it take to cross your coverage area, on the vehicle your riders will use, at the hour you will be trading? Most founders answer with kilometres. Kilometres do not deliver food.
A midday drive measures a city you will not operate in
The measurement is only meaningful at peak. A route that takes eleven minutes at two in the afternoon can take twenty six at eight, and the evening figure is the only one your riders experience. The same applies to rain and to the one road everyone uses.
Measure it three ways: the longest realistic crossing, the median restaurant to customer leg, and the time from a rider’s typical idle position to a typical restaurant.
That third one is the leg founders forget, and it is often the largest single component of cost per delivery.
Travel time is what actually draws your zones
Zones look like geography and behave like time. A zone is a promise that a rider can get from anywhere inside it to anywhere else within a tolerable window. Draw one on distance and you create a corner that quietly ruins your lateness numbers.
Dispatch, fees and capacity all belong to a zone, which is why this number arrives before any map work. It also decides whether a delivery fee can work at all: a thirty minute round trip and a small fee cannot coexist. The business model page sets out how the fee sits among the other revenue lines.
Basket Value and Dispatch Orders That Cannot Pay for Themselves
Founders quote an average basket. The average is the least useful form of this number, because your problem is the untypical orders. What you need is the distribution, and one count from it.
The average hides the orders that lose money
Two operations can share an identical average basket and behave completely differently. One has most orders clustered near the middle. The other has a mass of small single-item orders balanced by a few large family orders, and loses money on most of its volume without seeing it.
Once you know your cost per delivery, there is a basket value below which an order cannot carry its own delivery. Count what share of orders falls below it. That percentage is the number to write down, and it is often uncomfortable.
What the spread changes in the product
A wide spread with a heavy low tail makes minimum order values, small order fees, basket-building prompts and order batching into launch features rather than later optimizations. A narrow spread means you can ship a simpler fee model and revisit it when you have real data.
It also changes who you recruit. If small baskets dominate, a mix skewed toward higher ticket kitchens is worth more than twenty extra listings. Catalogue breadth is not the lever people expect when the tail is the problem.
Rider Cost and Drops Per Hour in Delivery Dispatch
These two travel together because neither means anything alone. The first is what an hour of rider availability costs in your market, in whatever arrangement you use. The second is how many completed deliveries that hour produces at your density.
However you engage riders, the hour still costs something
Some operators employ riders, some contract them, some pay purely per delivery and carry no idle cost on paper. The arrangement changes where the cost sits, not whether it exists. Pay per drop only and you pay a higher rate per drop, or nobody is online at peak.
Write down the all-in hourly figure including any incentives, guarantees or fuel contributions needed to keep someone online at eight on a Friday. Employment classification, insurance and background checks are your own local arrangements, and no platform decides them.
Drops per hour is a fact about density, not effort
Riders do not go faster because you ask them to. Drops per hour is produced by how close restaurants sit to customers, how long kitchens make people wait, and how often one delivery ends near the start of the next. Two drops an hour and three are wildly different economics, and the difference is geography rather than diligence.
Hourly cost divided by drops per hour gives cost per delivery, the number everything else hangs from. Grubhub Revenue Model: Dispatch Cost Per Delivery Beats a Higher Fee explains why that line is earned rather than priced, and Grubhub Business Model: Dispatch Depends on an Hourly Rider Flow covers how availability is produced. Your job is to know both inputs.
Restaurant Prep Time, and Specifically Its Variance
Ask a restaurant how long food takes and they will say fifteen minutes. Ask across a hundred Friday tickets and the answer becomes a range. The range is the number that matters, and almost nobody collects it.
An average of fourteen minutes tells you nothing
A kitchen that averages fourteen minutes and ranges from eight to thirty five is a fundamentally different engineering problem from one that averages eighteen and never leaves the fifteen to twenty band. The second is predictable. The first cannot be timed, only reacted to.
Send a rider early to the unpredictable kitchen and they wait, burning the hour you pay for. Send them late and the food sits under a lamp. Both arrive as complaints that look like delivery problems and are not.
Variance is a build requirement, not a complaint
High variance forces specific features into the build: a live ready-time signal from the kitchen rather than a static estimate, dispatch that holds assignment until confidence is reached, a handover step recording when food left the counter, and per-outlet timing that learns instead of one global setting.
Those separate a tablet that beeps from a real restaurant surface. The features page covers what that surface contains, and The Out-of-Stock Trap: Why Cheap Delivery Scripts Ruin Restaurant Relationships covers what happens when the restaurant side is an afterthought.
Payment Mix, Starting With the Cash Share
The next number is a single percentage: of the orders you expect, how many are paid in cash at the door? Founders in card-dominant markets answer zero and are usually right. Elsewhere they answer with a number they have not checked, and are usually wrong by a lot.
Cash decides whether reconciliation ships at launch
A zero cash operation has one money path. Money arrives online and is split later. A cash operation has a second path where the rider physically holds your revenue, and that path needs a float, a per-rider balance, an exposure limit and a shift-end settlement someone can audit.
That is not a toggle. It is a subsystem, and it is either in the first release or it is not. Discovering a twenty percent cash share after launch means riders carrying untracked money while you build the thing that tracks it.
Ask where the money physically goes
Beyond the cash share, write down which online methods you need at launch and how often you intend to pay restaurants and riders. Weekly and daily payouts are different builds, and daily payouts against cash orders are different again.
Gateway onboarding runs on someone else’s calendar, so the number to record now is simply the mix. What the platform ships with, and what is separately arranged, is set out on the facts page.
Order Shape and How Much of It Is Scheduled
Two more proportions, both cheap to estimate and both structural. First, the split between delivery, pickup and anything consumed on the premises. Second, the share of orders placed for later rather than for now.
Three fulfilment types, three different flows
A pickup order has no rider, no delivery fee and a different completion event. A counter order may never pass through the customer app and still has to reconcile against the same day’s takings. Delivery is the one everybody designs for and often the only one anyone tests.
If you expect a third of volume to be pickup, that is not a minor variant. It changes the fee model, the notifications, the proof of completion and what the restaurant sees. Guessing here produces a pickup flow that converts worse than the phone it replaced.
Scheduled orders change the dispatcher, not the cart
Letting a customer choose a later slot is an afternoon of front end work. Honouring it is not. Capacity has to be reserved against a future hour, the kitchen told at the right moment rather than immediately, and dispatch has to plan forward while still reacting to live demand.
If you intend to serve offices or any recurring weekday lunch, your scheduled share will not be small, and the dispatcher you need is a different one. Estimate the share now, even roughly, because retrofitting forward planning into a reactive dispatcher is not a configuration change.
The Eight Numbers and What Each One Decides
Collected in one place, the list fits on a single page. That is the point. A founder who can hand over this page stops receiving guesses, because there is nothing left to invent.
The measurement sheet every dispatch quote should start from
| What you measure | How it is expressed | What it decides in the build |
|---|---|---|
| Peak orders per hour | Count in your single busiest hour | Assignment design, concurrent riders, tracking load, whether batching is needed |
| Peak travel time | Minutes across the area at trading hours | Zone shape, promised windows, whether a delivery fee can work |
| Basket distribution | Share of orders below break-even value | Minimum order rules, small order fees, batching, restaurant mix |
| Rider cost per hour | All-in cost of one hour of availability | Fleet model, incentive tooling, shift and utilization reporting |
| Drops per rider hour | Completed deliveries per online hour | Cost per delivery, capacity planning, zone viability |
| Prep time variance | The range, not the average | Ready-time signals, dispatch timing, handover records, per-outlet learning |
| Cash share | Percentage paid at the door | Float, rider balances, exposure limits, shift settlement |
| Order shape | Delivery, pickup and scheduled proportions | Fee model, completion events, forward-planning dispatch |
Nothing on that page requires a platform or a developer. It requires two weeks of deliberate attention and a willingness to write down what you find rather than what you hoped.
How to Measure All of This Before You Have a Platform
The objection is always the same: these numbers come from operating, and you cannot operate without the platform you are scoping. That is half true. Four cheap exercises produce honest versions of every figure above, and none needs software.
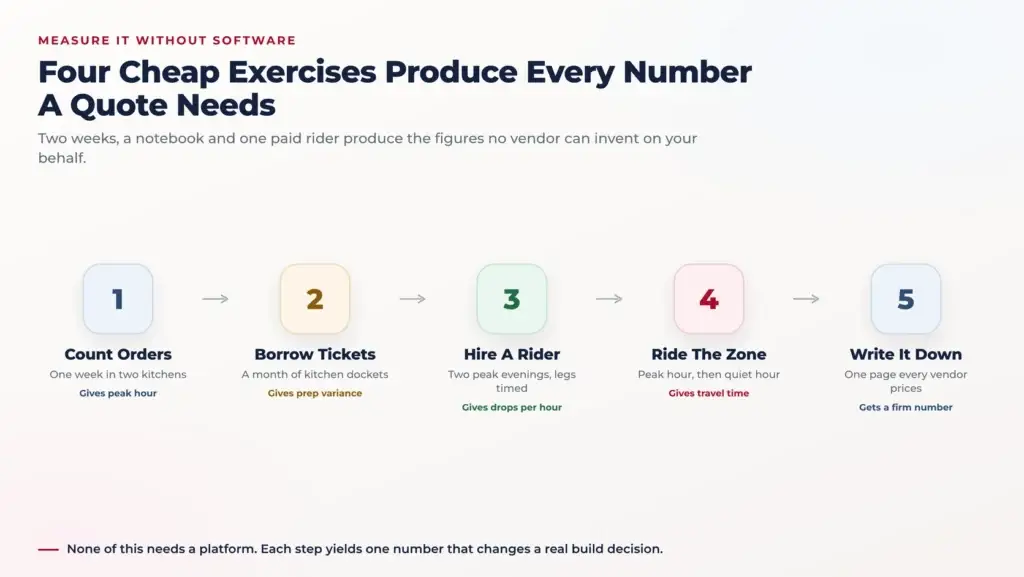
Image Source: AI-generated visual by Miracuves
One week and a notebook for the peak
Pick the two or three restaurants you most want on the platform and sit in them during trading hours for a week, or pay a student to. Record the time of every order that leaves for delivery. Seven evenings of tally marks give you a peak hour, a peak fifteen minutes and a weekday to weekend ratio.
Scale honestly. Three observed kitchens and twelve at launch gives you a per-restaurant rate, not a platform peak. Multiplying by four is optimistic because new listings ramp slowly, but it is a defensible upper bound to design against.
A handful of kitchens’ own order books
Restaurants already hold most of what you need. Their tickets carry order times, item counts and values, and many carry the time the food was called away. Three cooperative kitchens will hand over a month of that if you explain what you are doing.
From that you get basket distribution directly, prep variance if tickets are timestamped at both ends, and the real mix of item counts. If they are not timed, stand in the kitchen with a stopwatch for two services and time forty tickets. Forty is enough to see a range.
One rider, two evenings, paid properly
Hire one rider for two peak evenings and run deliveries for one or two of those restaurants by phone. Pay the rate you expect to pay. Record every leg: time leaving, time arriving at the kitchen, waiting time, time to the customer, time to the next pickup.
Two evenings produce your real drops per hour, your real waiting time and a first honest cost per delivery. It will be worse than the model in your deck, which is the entire value of the exercise.
A timed drive at the hour that matters
Ride the widest crossing of your intended area at the hour you plan to be busiest, on the vehicle type you expect to use, twice on different days. Then do the same at the quietest hour. The gap between those two times is what ruins naive zone maps.
While you are out, note where riders would plausibly wait between jobs. That idle position is the start of the next delivery, and its distance to your restaurant cluster is the third leg most cost models omit.
What Each Number Changes Inside the Build
None of this is an interrogation for its own sake. Each figure maps to a decision someone has to make, and if you do not make it, the vendor makes it silently on your behalf.
Peak changes the shape of assignment
Below a modest concurrency, assigning the nearest available rider works and needs little more than a loop. Above it you need offers with timeouts, re-offers, protection against double assignment and a way to shed load when orders outnumber riders. That line is the biggest single driver of dispatch complexity.
Travel time changes the map and the promise
Zone boundaries, fee bands and the delivery window you display all derive from peak travel time. Get it wrong and you ship a platform that is technically correct and operationally late, then spend months adjusting an admin panel to compensate for a bad map.
Cash changes the path the money takes
Every cash order creates a small debt from a rider to the business that must be recorded, limited and settled. Retrofitting that means rebuilding the ledger everything else already writes to, which is among the most expensive changes to a live operation.
Founder Decision Signals
Speed
Two weeks of measurement usually shortens the build, because scope stops moving. Most schedule slippage comes from numbers discovered after development started, not from work that was hard.
Cost
Cost per delivery is the only figure that compounds. It is produced by rider hourly cost divided by drops per hour, and both inputs are measurable before a single line of code exists.
Scalability
Peak orders per hour, not the daily total, decides whether assignment needs offers, timeouts and backpressure. Design for the worst ninety minutes and the rest of the week is free.
Market Fit
If most of your basket distribution sits below break-even, the answer is a different restaurant mix or a different fee model, not more listings and not a bigger marketing budget.
The Brief You Can Write Once You Have Them
With the sheet finished, the brief writes itself. One page of measurements, one paragraph of intent, and a list of what you already know you will not do in version one.
What a numbered brief actually reads like
It reads like an operation rather than an aspiration.
Peak of roughly ninety orders in the busiest hour. Twenty two minutes to cross the zone at seven in the evening. A fifth of baskets below break-even. Riders completing around two and a half drops an hour at a known cost. Prep ranging from nine to thirty minutes. A quarter of payments in cash, a tenth of orders scheduled.
Every one of those is falsifiable, which is what makes it useful. A vendor can now tell you which parts of that operation their platform already handles and which parts need work, rather than pricing a fog.
Why that gets a firm number and a vague brief gets a range
A range is a vendor pricing their own uncertainty about you. Remove it and the range collapses, because the remaining unknowns are about their own work. This is also where the ready-made versus custom question becomes answerable instead of ideological, and Ready-Made Delivery Food delivery dispatch app vs Custom Development: What Should Food Delivery Startups Choose? works through it.
It is also how you judge a partner rather than a price. A team that reads your sheet and immediately asks about the third leg, or about a refunded cash order, has operated one of these. Our food delivery app engineering team works from exactly this sheet.
Quoting a daily total and calling it demand
Four hundred orders a day is not a specification. It divides into an hour that never happens. Give the peak hour or give nothing.
Measuring travel time at a convenient hour
A midday crossing describes a city you will not trade in. Every timing has to come from the hour you intend to be busiest, in the conditions you will face.
Reporting an average basket with no spread
Averages hide the orders that cannot carry a delivery. Without the share below break-even, you cannot tell whether you need minimum orders, batching or a different restaurant mix.
Taking a kitchen’s word for prep time
Every kitchen says fifteen minutes. Forty timed tickets say something less comfortable, and the range is what dispatch is designed around, not the number the owner remembers.
Treating cash as a setting rather than a subsystem
A cash share means floats, per-rider balances, exposure limits and shift settlement. Deciding it after launch means rebuilding the ledger every other part of the platform writes into.
Measuring once and never again
These numbers move as the zone matures. The first sheet scopes the build; re-measured each quarter, it tells you whether the operation is improving or simply growing.
The Numbers That Matter Less Than Founders Think
Founders arrive with a different set of numbers entirely, usually the ones in the pitch deck. They are not worthless, but none changes an engineering decision, and all can be produced without knowing anything about your operation.
Total addressable market
A market size figure describes an opportunity nobody disputes. It does not tell a developer how many assignment decisions happen per minute, nor whether a delivery in your zone pays for itself. Two operators in one market can have opposite unit economics.
The measurement that replaces it is narrower and far more useful: how many orders per hour your first cluster of restaurants can actually produce at peak. That is your real addressable market for the first six months.
The competitor feature list
A screenshotted list of everything an incumbent’s app does describes features built over years for an operation with different numbers from yours. Half exist because of a constraint you do not have, and a few because of one you do but cannot see from outside.
Matching a feature list is the most reliable way to build an expensive platform that still cannot dispatch at peak. Start from what your measurements demand. Which Features Does a Food Delivery Dispatch App Need for Order Assignment, Rider Tracking, and Fleet Control? sets out what the core needs to contain.
The size of the city
Population is a poor proxy for viability, because delivery economics come from density and travel time rather than headcount. A dense district inside a mid-sized city outperforms a sprawling larger one, and no population figure shows that.
What matters is the geography of your first zone, which should be embarrassingly small. Grubhub Marketing for Startups: Cold Start in a Delivery Dispatch Zone covers why that constraint helps rather than limits, and the food delivery solution overview sets out the operating shapes available.
Final Thoughts: The Cheapest Two Weeks You Will Spend
Produce the eight numbers first. Then a quote for a Grubhub-style platform means something.
Nothing in this list needs a platform, a partner or a budget of consequence. It needs a notebook, a few cooperative kitchens, one rider for two evenings and a willingness to record what is true rather than what was assumed. Two weeks of that changes the build more than two months of specification documents.
It also changes the conversation you have with every vendor afterwards. You stop asking what a food delivery dispatch app costs, which nobody can answer, and start asking what it takes to run the operation you have now measured, which has an answer. The difference between a defensive range and a firm number is one page of figures.
If you have the sheet, or want help deciding which of the eight to measure first, bring it to a working session rather than a sales call. You can schedule a consultation and we will walk through your numbers, what they imply about zone shape and dispatch behaviour, and the shortest honest path to a first zone.
FAQs
What does a Grubhub clone script cost, and why do quotes differ?
Because each one is pricing a different imagined operation. Given no numbers, a vendor either pads wide to cover the worst plausible case, which loses the deal, or quotes the smallest coherent build and lets the rest arrive as change requests. Neither is dishonest. Supply your peak hour, travel time, basket spread, rider cost, prep variance, cash share and order shape, and the guesswork that produced the gap disappears.
Why does peak orders per hour size a delivery dispatch build?
A dispatch system never experiences a day. It experiences the busiest ninety minutes of one. Spread a daily total evenly and you get an hourly rate that no hour ever sees. The peak figure divided by drops per rider hour gives the minimum riders who must be online at once, and it decides whether assignment needs offers, timeouts, re-offers and backpressure or just a simple loop.
How do I size a delivery dispatch zone before launching it?
Ride or drive the widest crossing of your intended area at exactly the hour you plan to be busiest, on the vehicle type your riders will use, twice on different days. Then repeat at the quietest hour. Record three legs: the longest crossing, the median restaurant to customer run, and the distance from where a rider would idle to your restaurant cluster. That third leg is the one most cost models omit.
Why is average basket value not good enough?
Two operations can share an identical average and behave completely differently. One clusters near the middle; the other has a mass of small single-item orders balanced by a few large family orders and loses money on most of its volume. What you need is the share of orders falling below the basket value at which a delivery cannot pay for itself. That percentage decides minimum order rules, small order fees and batching.
How do I work out dispatch cost per delivery before launch?
Hire one rider for two peak evenings at the rate you actually expect to pay, run real deliveries for one or two restaurants by phone, and time every leg including the wait at the counter. Two evenings give you honest drops per hour. Divide your all-in hourly rider cost by that figure and you have cost per delivery, which will be worse than your model and far more useful.
Why does restaurant prep time variance matter more than the average?
A kitchen averaging fourteen minutes but ranging from eight to thirty five cannot be timed, only reacted to. Send a rider early and they wait, burning a paid hour. Send them late and food sits under a lamp. High variance forces a live ready-time signal from the kitchen, dispatch that holds assignment until confidence is reached, a recorded handover, and per-outlet timing that learns rather than one global setting.
Does the share of cash payments really change the build that much?
Yes. A card-only operation has one money path. A cash operation adds a second where the rider physically holds your revenue, and that path needs a float, a per-rider balance, an exposure limit and an auditable shift-end settlement. That is a subsystem, not a toggle. Discovering a meaningful cash share after launch means rebuilding the ledger every other part of the platform already writes into.
Which numbers matter less than founders expect?
Total addressable market, competitor feature lists and city population. None of them changes an engineering decision, and all can be produced without knowing anything about your operation. Two operators in one market can have opposite unit economics. Replace market size with the orders per hour your first restaurant cluster can produce at peak, and replace population with the density and travel time of one deliberately small first zone.
Miracuves is an independent software development company. We are not affiliated with, connected to, sponsored by, or endorsed by any company or product named in this article.
Terms such as “X Clone” are used descriptively. It is how the software industry refers to building a platform with functionality comparable to a known service, and how clients search for it.
The entire design and codebase of our products is built by our own team. Our products contain no code, design, graphics, or content originating from any third-party website or applications.
All third-party names and marks referenced in this article are the property of their respective owners, referenced solely to identify the services discussed.