
Key Takeaways
- Group-buying apps can earn through commissions, seller subscriptions, promotions, and service fees.
- Transaction commissions create revenue whenever a completed order meets platform rules.
- Promoted listings and sponsored campaigns monetize seller demand for greater visibility.
- Merchant tools, analytics, and premium plans can create recurring platform revenue.
- A balanced revenue model should support buyer value, seller profitability, and platform sustainability.
Revenue Model Signals
- Define commission rates by product category, seller type, or campaign structure.
- Create seller plans with clear limits, permissions, tools, and reporting access.
- Give merchants paid options for featured products, campaign promotion, and priority placement.
- Plan seller settlements, refunds, disputes, taxes, and payment-gateway deductions.
- Track revenue by order, seller, campaign, category, promotion, and subscription plan.
Real Insights
- High order volume does not guarantee profit when discounts and fulfillment costs are poorly managed.
- Advertising revenue becomes stronger after the marketplace develops meaningful buyer demand.
- Too many buyer-facing fees can reduce participation in group deals.
- Every revenue stream requires connected product, payment, reporting, and admin workflows.
- Miracuves develops group-buying marketplaces with commissions, seller plans, promotions, and revenue controls.
Group buying apps make money by combining social shopping behavior with marketplace monetization. Instead of depending only on product margins, these platforms create revenue from seller commissions, merchant promotions, featured listings, delivery fees, subscription tools, payment flows, and value-added services.
For founders, this model is attractive because it turns ecommerce into a shared buying experience. Users invite others to unlock lower prices, sellers gain access to demand-driven traffic, and the platform earns by controlling visibility, transactions, engagement, and marketplace operations.
But the real opportunity is not just launching another ecommerce app. The opportunity is building a social commerce marketplace where every feature supports monetization: group deals, seller dashboards, referral flows, admin controls, product ranking, wallet usage, campaign tools, and repeat purchase loops.
That is why founders should understand the revenue model before deciding the app structure. A group buying app can look simple on the front end, but the revenue engine depends on how well the marketplace connects buyers, merchants, offers, payments, logistics, and platform control.
What Is a Group Buying App Revenue Model?
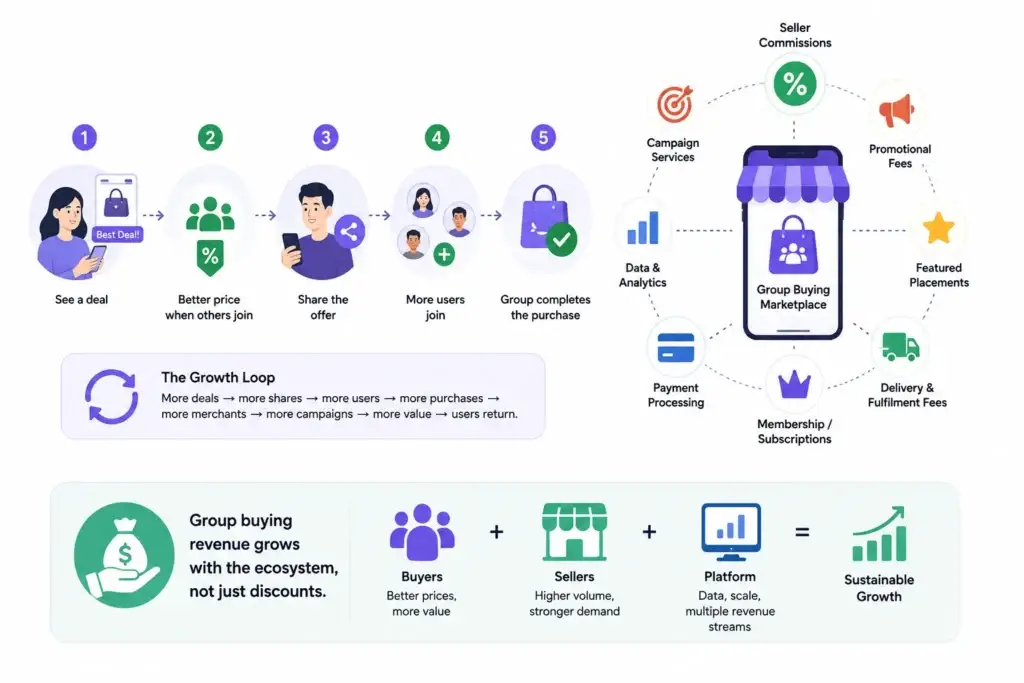
Image Source: AI-generated visual by Miracuves
A group buying app revenue model explains how a social commerce marketplace earns money from buyers, sellers, transactions, promotions, and platform services.
In a normal ecommerce app, users usually browse products, compare prices, add items to cart, and check out individually. In a group buying app, the buying journey is more social. A user may start a deal, invite friends, join a team purchase, unlock a discount, or share an offer inside a community.
This social layer changes the revenue logic.
The platform is not only selling products. It is creating demand clusters. When multiple users buy together, sellers get higher order volume, buyers receive better pricing, and the platform gains more data about product demand, category performance, and purchasing behavior.
That creates several monetization opportunities:
- Seller commissions on completed orders.
- Promotional fees from merchants who want visibility.
- Featured product placements.
- Delivery and fulfilment fees.
- Membership or subscription plans.
- Payment processing margins.
- Data and analytics tools for sellers.
- Campaign management services.
- Cross-selling and category expansion.
For founders, the important point is this: group buying revenue is strongest when the platform is designed as a marketplace ecosystem, not just a discount catalogue.
Read More: How Group Buying Marketplaces Turn Social Sharing Into Ecommerce Growth
Why Group Buying Apps Can Be More Monetization-Friendly Than Traditional Ecommerce
Traditional ecommerce platforms often fight for traffic through paid ads, discounts, influencer campaigns, and marketplace competition. Group buying apps can reduce some of that pressure by making users part of the distribution loop.
When users invite friends to unlock deals, the platform benefits from social sharing. This does not remove the need for marketing, but it can make acquisition more efficient because buyers help spread offers.
This creates three founder advantages.
First, group buying encourages repeat visits because users return to check whether deals are active, whether enough people have joined, and whether new offers are available.
Second, sellers become more willing to pay for visibility when the platform can show active buyer demand.
Third, the platform can monetize different layers of the marketplace instead of depending on one high commission rate.
That is why a strong group buying marketplace should be planned around both user engagement and seller monetization. If users are active but sellers cannot promote products, the platform leaves revenue on the table. If sellers can pay for promotion but buyers are not engaged, advertising loses value.
The balance between buyer demand and merchant monetization is what makes this model powerful.
Main Revenue Streams for Group Buying Apps
A group buying app can use several revenue streams depending on the market, category, seller base, and product strategy.
Group Buying App Revenue Streams
| Revenue Stream | How It Works | Founder Impact |
|---|---|---|
| Seller Commission | The platform takes a percentage or fixed fee from each completed order. | Creates direct revenue from transactions without charging buyers upfront. |
| Merchant Advertising | Sellers pay to promote products in feeds, categories, search results, or deal sections. | Turns platform traffic into a scalable seller-side revenue stream. |
| Featured Listings | Merchants pay for premium visibility during campaigns or high-demand periods. | Helps sellers compete for attention while giving the platform additional income. |
| Subscription Plans | Sellers pay monthly or annually for advanced tools, analytics, or higher listing limits. | Improves recurring revenue and reduces dependence on transaction volume alone. |
| Delivery Fees | The platform earns from delivery charges, fulfilment coordination, or logistics partnerships. | Adds monetization around order fulfilment and local operations. |
| Payment and Wallet Flows | The app may earn through wallet usage, convenience fees, or payment-related service charges where allowed. | Supports smoother checkout and creates additional monetization opportunities. |
| Seller Tools | Merchants pay for analytics, campaign tools, inventory insights, or demand forecasting. | Creates value-added revenue from business users, not only end customers. |
1. Seller Commissions on Completed Orders
Seller commission is the simplest revenue stream for a group buying app. Every time a buyer completes an order, the platform charges the merchant a commission.
This model works because the platform is helping sellers access demand. In group buying, that demand can be more valuable than normal ecommerce traffic because buyers are often price-sensitive, motivated, and ready to purchase once the group deal is active.
However, founders should avoid making seller commission the only revenue stream. If the commission is too high, sellers may resist joining the platform. If the commission is too low, the platform may struggle to cover marketing, support, payment, and operational costs.
The better approach is to keep commission sustainable and add seller-side revenue streams such as promotions, subscriptions, and campaign tools.
A commission model should be controlled from the admin dashboard. The platform operator should be able to set category-wise commission, seller-wise commission, campaign-specific commission, and promotional commission rules. Without that control, every pricing change becomes a development dependency.
2. Merchant Advertising and Sponsored Product Visibility
Merchant advertising is one of the most important revenue streams for group buying apps because sellers want visibility where buyer intent is active.
In a group buying marketplace, sellers are not only competing on price. They are competing for placement inside product feeds, deal banners, search results, category pages, push notification campaigns, and limited-time offers.
This creates monetization opportunities such as:
- Sponsored product cards.
- Promoted deal placements.
- Category-level advertising.
- Homepage banners.
- Search visibility boosts.
- Campaign-based product promotion.
- Push notification promotions.
For founders, this revenue stream becomes stronger as the platform gains more users and repeat traffic. Sellers are more likely to pay for promotion when they can see that users are browsing, joining deals, sharing offers, and completing purchases.
That is why the app should include merchant promotion controls from the beginning. A seller dashboard should allow merchants to create campaigns, track visibility, monitor clicks, view order conversions, and understand which products perform better.
This is where Miracuves’ white-label marketplace approach can help founders plan the platform beyond basic buying and selling. A ready-made foundation can include the control layers needed to support seller visibility, admin approval, and monetization workflows.
3. Featured Listings and Deal Placement Fees
Featured listings are different from full advertising campaigns. They are simpler paid visibility options that allow sellers to place specific products in premium sections of the app.
For example, sellers may pay to appear in:
- Today’s deals.
- Trending group offers.
- Best value products.
- Category highlights.
- Limited-time campaigns.
- Festival or seasonal collections.
- Location-based deal sections.
This revenue stream is useful because it is easy for merchants to understand. Sellers may not always want to run complex ad campaigns, but they often understand the value of being featured in front of active buyers.
For founders, featured listings can become an early monetization layer even before advanced advertising systems are mature. The platform can start with manual admin-approved placements and later add automated bidding, performance dashboards, or seller self-service tools.
The key is to ensure that featured listings do not damage user trust. If low-quality products dominate premium sections only because sellers paid for placement, users may stop trusting recommendations. Admin approval, seller ratings, product quality checks, and review signals should guide visibility decisions.
4. Subscription Plans for Sellers
Subscription revenue can make a group buying marketplace more predictable. Instead of earning only when transactions happen, the platform can offer monthly or yearly plans to sellers.
Seller subscriptions may include:
- Higher product listing limits.
- Access to analytics dashboards.
- Campaign management tools.
- Priority support.
- Advanced inventory controls.
- Bulk upload options.
- Featured seller badges.
- Better reporting.
- Storefront customization.
- Automated discount campaign tools.
This model works best when the platform already delivers consistent value to merchants. Sellers are unlikely to pay monthly fees if the platform has low buyer activity. But once the marketplace has engaged shoppers, a subscription plan can help serious merchants grow faster.
For founders, seller subscription logic should be flexible. Different seller types may need different packages. Local sellers, wholesalers, category specialists, and large merchants may not need the same tools.
A strong admin panel should allow the platform operator to create subscription tiers, assign seller permissions, manage plan renewals, track payment status, and control what each seller can access.
5. Delivery, Fulfilment, and Logistics Revenue
Many group buying apps operate in categories where fulfilment matters: groceries, household goods, fashion, personal care, local products, electronics, or daily essentials.
That makes delivery and logistics another monetization layer.
The platform may earn from:
- Delivery fees charged to buyers.
- Seller-paid fulfilment charges.
- Delivery partner commissions.
- Express delivery fees.
- Minimum order value incentives.
- Local pickup or community collection charges.
- Logistics integration fees.
The right model depends on the operating market. Some founders may manage fulfilment directly. Others may use third-party logistics providers. Some may allow sellers to fulfil orders independently while the platform only coordinates tracking and dispute support.
The important point is that delivery fees should not be treated as an afterthought. If the app promises low prices but delivery costs feel unclear, users may abandon checkout. Transparent fee rules, cart-level delivery logic, location-based charges, and order tracking are essential.
For a group buying marketplace, fulfilment can also affect monetization because larger group orders may reduce per-order delivery cost. Founders can use this as a business advantage by encouraging group purchases in the same area, community, or delivery zone.
6. Payment, Wallet, and Checkout-Based Revenue
Payment flows can support revenue in several ways, depending on the business model and local regulations.
A group buying app may use:
- Wallet balance.
- Cashback credits.
- Referral credits.
- Group deal refunds.
- Partial payment flows.
- Payment gateway integrations.
- Convenience fees where appropriate.
- Loyalty points.
- Promotional vouchers.
Founders should be careful with payment-related monetization. Any fee, wallet logic, refund rule, or payment workflow must be transparent to users and aligned with the operating market’s legal and payment requirements.
The business value is not only direct revenue. A wallet or credit system can improve retention because users may return to use rewards, cashback, or group deal credits.
From a product perspective, wallet and checkout logic should connect with the admin dashboard. The platform operator should be able to view transactions, refunds, failed payments, seller settlements, commissions, and dispute records.
7. Value-Added Seller Tools and Analytics
As the platform grows, sellers need more than product listings. They need insights.
Value-added seller tools can include:
- Product performance reports.
- Buyer demand trends.
- Category-level analytics.
- Campaign performance data.
- Pricing suggestions.
- Inventory movement reports.
- Repeat purchase insights.
- Customer review summaries.
- Location-wise demand patterns.
These tools can be monetized as part of a seller subscription plan or offered as paid add-ons.
This revenue stream is powerful because it helps sellers improve their business. A merchant who understands which products convert, which deals attract buyers, and which campaigns drive repeat purchases is more likely to invest in the platform.
For founders, analytics should not be added only after launch. Even if advanced reporting comes later, the app foundation should collect clean data from the beginning: user activity, product clicks, deal joins, cart activity, checkout conversion, seller response times, refunds, and repeat purchase behavior.
Without clean data, future monetization becomes harder.
Founder Decision Signals: Which Revenue Streams Should You Start With?
Not every group buying app needs every revenue stream on day one. The right monetization sequence depends on the founder’s market, seller base, launch budget, and operational capacity.
Speed
Start with commissions, featured listings, and basic seller controls if you need a faster launch. Advanced ad bidding and analytics can be added after marketplace activity grows.
Cost
Revenue features affect development scope. A ready-made foundation can reduce build complexity because core marketplace, seller, buyer, and admin flows are already structured.
Scalability
Choose monetization features that can scale across categories, sellers, locations, and campaigns without requiring manual work for every small change.
Market Fit
If your market is price-sensitive, prioritize group deals, referral credits, seller promotions, and repeat purchase loops before complex subscription plans.
Suggested Monetization Sequence for a New Group Buying App
A new founder should avoid overloading the first version with too many monetization layers. Too many fees can discourage sellers and confuse buyers before the platform has trust.
A practical launch sequence may look like this:
| Launch Stage | Best Revenue Streams | Why It Works |
|---|---|---|
| Early Launch | Seller commission, delivery fee, basic featured listings | Simple to understand and easier to operate |
| Growth Stage | Merchant ads, campaign promotions, seller subscriptions | Works once traffic and seller competition increase |
| Scaling Stage | Analytics tools, advanced seller plans, category-level promotion, fulfilment partnerships | Adds deeper monetization after marketplace behavior is proven |
| Expansion Stage | Cross-category campaigns, loyalty programs, wallet flows, regional seller tools | Supports repeat usage and broader ecosystem revenue |
The goal is not to monetize everything immediately. The goal is to design the platform so monetization can grow without rebuilding the core architecture later.
This is where many founders make a mistake. They launch a simple ecommerce app first, then later realize they need group deal logic, seller campaign tools, wallet credits, admin approval, campaign analytics, and commission flexibility. Adding these after launch can become expensive and disruptive.
Planning the revenue model early helps avoid that problem.
Features That Support Revenue in a Group Buying Marketplace
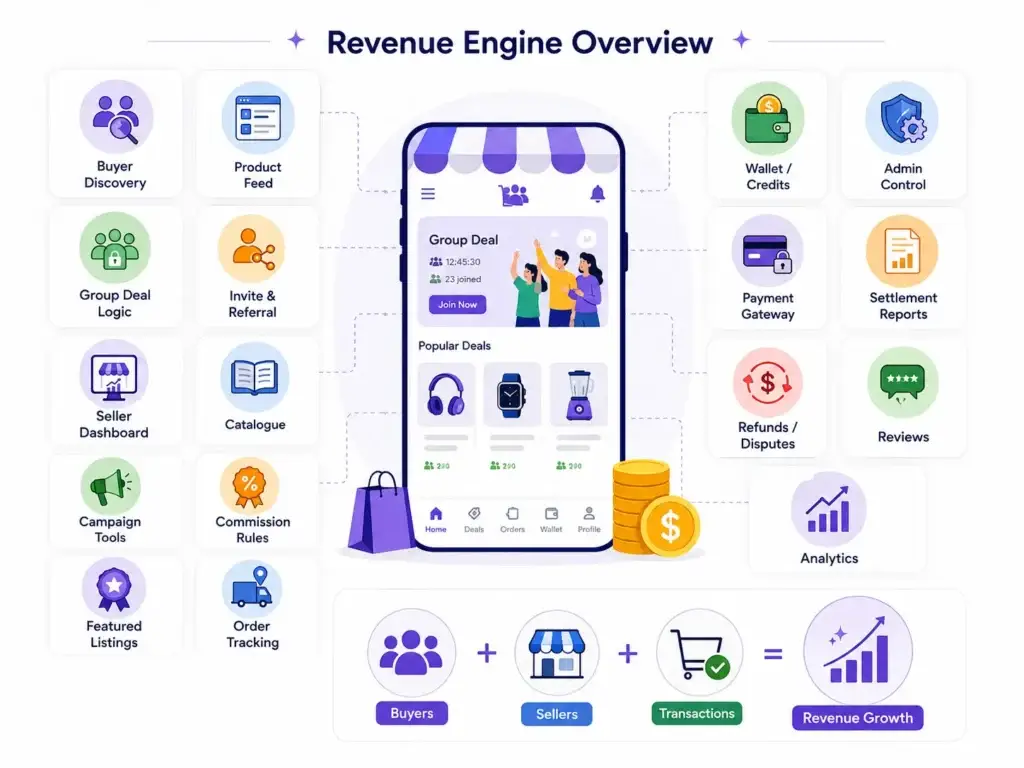
Image Source: AI-generated visual by Miracuves
Revenue streams do not work in isolation. They need product features behind them.
A commission model needs order tracking, seller settlement, refund rules, and admin reporting. Merchant advertising needs product visibility controls, campaign creation, approval workflows, and analytics. Seller subscriptions need plan management, payment collection, and permission control.
Founders should think of revenue features as connected systems.
Important revenue-supporting features include:
- Buyer app with group deal discovery.
- Product feed with personalized and category-based browsing.
- Deal creation and group purchase logic.
- Referral and invite workflows.
- Seller dashboard.
- Product catalogue management.
- Campaign and promotion tools.
- Commission management.
- Featured listing controls.
- Delivery and order tracking.
- Wallet, cashback, or credits.
- Admin dashboard.
- Payment gateway integration.
- Seller settlement reports.
- Refund and dispute handling.
- Reviews and ratings.
- Analytics dashboard.
A ready-made group buying marketplace solution can help founders move faster when the goal is to validate demand without building every buyer, seller, campaign, and admin module from zero.
Common Mistakes Founders Make With Group Buying App Monetization
Depending Only on Commission Revenue
Commission revenue is useful, but relying on it alone can limit platform earnings. Seller ads, featured listings, subscriptions, and campaign tools can create stronger monetization once marketplace activity grows.
Launching Without Seller Promotion Tools
If sellers cannot promote products, the platform misses a major revenue layer. Even basic featured listings or campaign placements can help sellers gain visibility while creating income for the marketplace.
Ignoring Admin Control
Without admin control over commissions, campaigns, refunds, seller approvals, and deal visibility, the founder becomes dependent on developers for routine business changes.
Using Discounts Without Retention Logic
Discounts may attract users, but they do not guarantee repeat purchases. Group buying apps should connect deals with referrals, credits, wallet flows, loyalty, and personalized discovery.
How This Revenue Model Supports the Bigger Business Model
The revenue model explains how the platform earns. The business model explains how the full marketplace works.
For a group buying app, the business model includes buyer acquisition, seller onboarding, product supply, group deal mechanics, fulfilment, pricing strategy, social sharing, payment flow, customer support, and marketplace governance.
The revenue model sits inside that structure.
For example:
- Group deals increase buyer participation.
- Buyer participation attracts sellers.
- Seller competition creates demand for paid visibility.
- Paid visibility creates platform revenue.
- Better seller tools improve merchant retention.
- Repeat buyers improve transaction volume.
- Admin controls keep the marketplace manageable.
Founders who want to understand the complete operating structure can read the social commerce business model breakdown before finalizing their launch strategy.
The stronger approach is to connect both layers: first understand how the marketplace operates, then decide which revenue streams should be active at launch and which can be added later.
Read More: How to Reduce Fraud in Group-Buying Marketplaces: Seller, Payment, and Coupon Abuse Controls
How Miracuves Helps Founders Launch Group Buying Marketplace Apps
Building a group buying app from zero requires more than frontend design. The platform needs buyer flows, seller dashboards, group purchase logic, product management, order tracking, payments, promotions, admin controls, and monetization workflows.
Miracuves helps founders create ready-made and white-label app foundations that can be customized around business goals, branding, revenue model, and launch strategy.
For founders, this matters because the first version of the app should not only look usable. It should support the business model from day one.
A group buying marketplace may need:
- Customer app.
- Seller panel.
- Admin dashboard.
- Group deal engine.
- Product catalogue.
- Order management.
- Commission control.
- Featured listing management.
- Payment gateway integration.
- Delivery workflow.
- Campaign tools.
- Notifications.
- Reviews and ratings.
- Reporting dashboard.
With a ready-made foundation from Miracuves, founders can focus on positioning, seller acquisition, buyer demand, and monetization strategy instead of building every module from scratch.
Final Thoughts: Build the Revenue Model Before You Build the App
A group buying app makes money when its marketplace design supports both buyer engagement and seller monetization. Commissions, merchant ads, featured listings, subscriptions, delivery fees, wallet flows, and seller tools can all contribute to revenue, but they need the right product foundation behind them.
For founders, the best decision is not to copy a popular marketplace blindly. It is to understand why group buying works, how sellers benefit, where platform revenue comes from, and which monetization layers should be active at each stage.
Miracuves helps founders move from idea to launch faster with ready-made, white-label app solutions built for branding, admin control, monetization, and source-code ownership.
FAQs
How do group buying apps make money?
Group buying apps make money through seller commissions, merchant advertising, featured listings, delivery fees, seller subscriptions, wallet flows, and value-added merchant tools. The strongest platforms usually combine multiple revenue streams instead of depending only on transaction fees.
What is the main revenue stream for a group buying marketplace?
The main revenue stream is usually seller-side monetization. This can include commissions on orders, paid promotions, sponsored product placements, and featured listings. As traffic grows, merchant advertising can become a major revenue layer.
Can a group buying app make money without charging users?
Yes. Many group buying apps can keep the buyer experience low-cost while monetizing merchants through commissions, advertising, seller tools, and promotional placements. This works best when the platform has active buyer demand.
Are seller subscriptions useful for group buying apps?
Seller subscriptions can be useful once the marketplace has enough traffic and seller value. Subscriptions may include analytics, higher listing limits, promotional tools, priority support, or advanced campaign features.
What features are needed to monetize a group buying app?
A monetization-ready group buying app needs buyer flows, group deal logic, seller dashboards, product management, commission control, campaign tools, payment integration, delivery tracking, admin controls, analytics, and dispute management.
Should founders start with commissions or advertising?
Most founders should start with commissions and simple featured placements. Advertising becomes stronger after the app has enough buyer traffic, seller competition, and campaign performance data.
How does group buying improve marketplace revenue?
Group buying improves marketplace revenue by increasing order volume, encouraging social sharing, creating repeat visits, and making seller visibility more valuable. When sellers see active demand, they are more likely to pay for promotions and tools.
Can Miracuves help build a group buying marketplace app?
Yes. Miracuves helps founders build ready-made and white-label marketplace app solutions with source code, branded design, admin control, and monetization-ready workflows for faster launch and market validation.
Miracuves is an independent software development company. We are not affiliated with, connected to, sponsored by, or endorsed by any company or product named in this article.
Terms such as “X Clone” are used descriptively. It is how the software industry refers to building a platform with functionality comparable to a known service, and how clients search for it.
The entire design and codebase of our products is built by our own team. Our products contain no code, design, graphics, or content originating from any third-party website or applications.
All third-party names and marks referenced in this article are the property of their respective owners, referenced solely to identify the services discussed.